

RNA-Seq analysis to capture the transcriptome landscape of a single cell
- PMID: 20203668
- PMCID: PMC3847604
- DOI: 10.1038/nprot.2009.236
RNA-Seq analysis to capture the transcriptome landscape of a single cell
Abstract
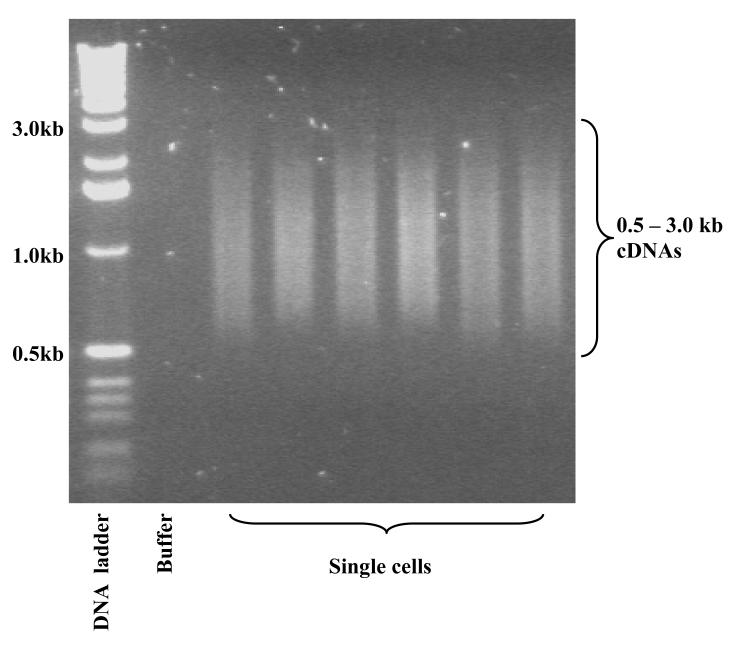
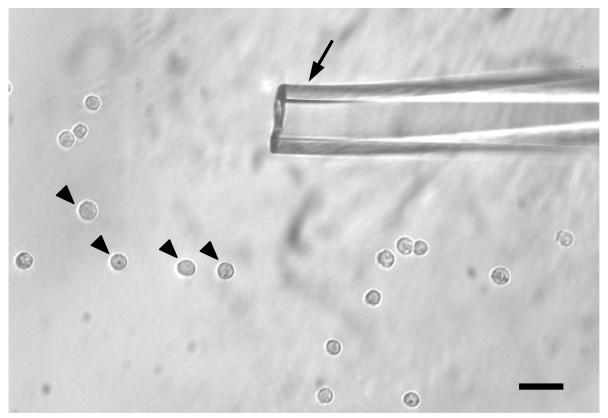
We describe here a protocol for digital transcriptome analysis in a single mouse oocyte and blastomere using a deep-sequencing approach. In this method, individual cells are isolated and transferred into lysate buffer by mouth pipette, followed by reverse transcription carried out directly on the whole cell lysate. Free primers are removed by exonuclease I and a poly(A) tail is added to the 3' end of the first-strand cDNAs by terminal deoxynucleotidyl transferase. Single-cell cDNAs are then amplified by 20 + 9 cycles of PCR. The resulting 100-200 ng of amplified cDNAs are used to construct a sequencing library, which can be used for deep sequencing using the SOLiD system. Compared with cDNA microarray techniques, our assay can capture up to 75% more genes expressed in early embryos. This protocol can generate deep-sequencing libraries for 16 single-cell samples within 6 d.
Figures
References
-
- Schena M, Shalon D, Davis RW, Brown PO. Quantitative monitoring of gene expression patterns with a complementary DNA microarray. Science. 1995;270:467–470. - PubMed
-
- DeRisi J, et al. Use of a cDNA microarray to analyse gene expression patterns in human cancer. Nat. Genet. 1996;14:457–460. - PubMed
-
- Lockhart DJ, et al. Expression monitoring by hybridization to high-density oligonucleotide arrays. Nat. Biotechnol. 1996;14:1675–1680. - PubMed
Publication types
MeSH terms
Substances
Grants and funding
LinkOut - more resources
Full Text Sources
Other Literature Sources
