Plasticity of horizontal connections at a functional border in adult rat somatosensory cortex
- PMID: 20204080
- PMCID: PMC2832108
- DOI: 10.1155/2009/294192
Plasticity of horizontal connections at a functional border in adult rat somatosensory cortex
Abstract
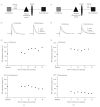
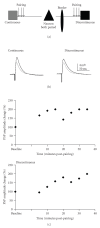
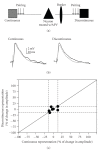
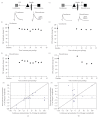
Horizontal connections in superficial cortical layers integrate information across sensory maps by connecting related functional columns. It has been hypothesized that these connections mediate cortical reorganization via synaptic plasticity. However, it is not known if the horizontal connections from discontinuous cortical regions can undergo plasticity in the adult. Here we located the border between two discontinuous cortical representations in vivo and used either pairing or low-frequency stimulation to induce synaptic plasticity in the horizontal connections surrounding this border in vitro. Individual neurons revealed significant and diverse forms of synaptic plasticity for horizontal connections within a continuous representation and discontinuous representations. Interestingly, both enhancement and depression were observed following both plasticity paradigms. Furthermore, plasticity was not restricted by the border's presence. Depolarization in the absence of synaptic stimulation also produced synaptic plasticity, but with different characteristics. These experiments suggest that plasticity of horizontal connections may mediate functional reorganization.
Figures


Similar articles
-
Diverse excitatory and inhibitory synaptic plasticity outcomes in complex horizontal circuits near a functional border of adult neocortex.Brain Res. 2011 Oct 6;1416:10-25. doi: 10.1016/j.brainres.2011.07.062. Epub 2011 Aug 7. Brain Res. 2011. PMID: 21890112
-
Asymmetric spike-timing dependent plasticity of striatal nitric oxide-synthase interneurons.Neuroscience. 2009 Jun 2;160(4):744-54. doi: 10.1016/j.neuroscience.2009.03.015. Epub 2009 Mar 19. Neuroscience. 2009. PMID: 19303912
-
Synaptic organization and input-specific short-term plasticity in anterior cingulate cortical neurons with intact thalamic inputs.Eur J Neurosci. 2007 May;25(9):2847-61. doi: 10.1111/j.1460-9568.2007.05485.x. Eur J Neurosci. 2007. PMID: 17561847
-
Elementary forms of synaptic plasticity in the visual cortex.Biol Res. 1995;28(1):73-80. Biol Res. 1995. PMID: 8728822 Review.
-
Plasticity of neuronal excitability: Hebbian rules beyond the synapse.Arch Ital Biol. 2007 Nov;145(3-4):277-87. Arch Ital Biol. 2007. PMID: 18075121 Review.
Cited by
-
Tactile learning transfer from the hand to the face but not to the forearm implies a special hand-face relationship.Sci Rep. 2018 Aug 6;8(1):11752. doi: 10.1038/s41598-018-30183-5. Sci Rep. 2018. PMID: 30082760 Free PMC article. Clinical Trial.
-
Metaplasticity of horizontal connections in the vicinity of focal laser lesions in rat visual cortex.J Physiol. 2010 Dec 1;588(Pt 23):4695-703. doi: 10.1113/jphysiol.2010.198192. Epub 2010 Oct 20. J Physiol. 2010. PMID: 20961999 Free PMC article.
-
Neuromagnetic correlates of adaptive plasticity across the hand-face border in human primary somatosensory cortex.J Neurophysiol. 2016 Apr;115(4):2095-104. doi: 10.1152/jn.00628.2015. Epub 2016 Feb 17. J Neurophysiol. 2016. PMID: 26888099 Free PMC article.
References
-
- Stettler DD, Das A, Bennett J, Gilbert CD. Lateral connectivity and contextual interactions in macaque primary visual cortex. Neuron. 2002;36(4):739–750. - PubMed
-
- Merzenich MM, Kaas JH, Wall J. Topographic reorganization of somatosensory cortical areas 3b and 1 in adult monkeys following restricted deafferentation. Neuroscience. 1983;8(1):33–55. - PubMed
-
- Merzenich MM, Kaas JH, Wall JT. Progression of change following median nerve section in the cortical representation of the hand in areas 3b and 1 in adult owl and squirrel monkeys. Neuroscience. 1983;10(3):639–665. - PubMed
-
- Merzenich MM, Nelson RJ, Stryker MP. Somatosensory cortical map changes following digit amputation in adult monkeys. Journal of Comparative Neurology. 1984;224(4):591–605. - PubMed
-
- Gilbert CD. Horizontal integration and cortical dynamics. Neuron. 1992;9(1):1–13. - PubMed
Publication types
MeSH terms
Substances
Grants and funding
LinkOut - more resources
Full Text Sources

