. 2010 Jul-Aug;26(4):1014-23.
doi: 10.1002/btpr.395.

Fluid flow through a high cell density fluidized-bed during centrifugal bioreactor culture

Affiliations

Fluid flow through a high cell density fluidized-bed during centrifugal bioreactor culture

Christopher J Detzel et al. Biotechnol Prog. 2010 Jul-Aug.

Abstract

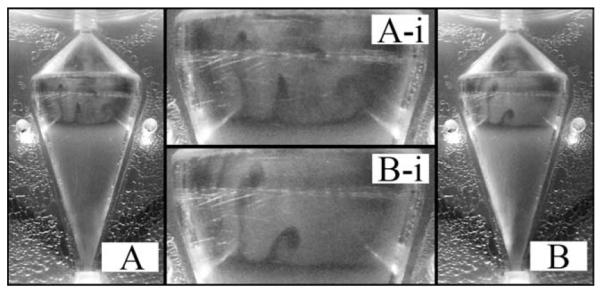
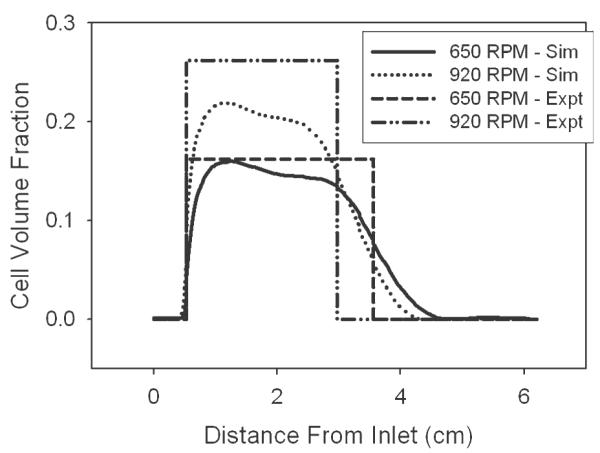
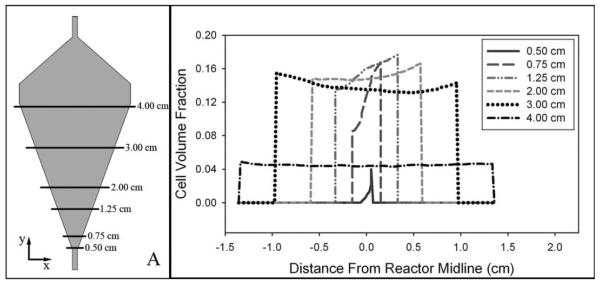
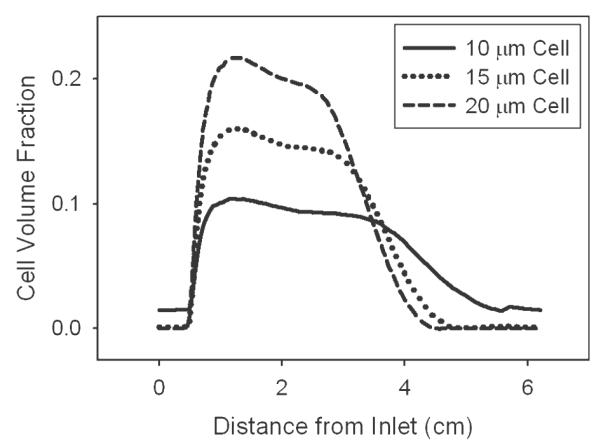
An increasing demand for products such as tissues, proteins, and antibodies from mammalian cell suspension cultures is driving interest in increasing production through high-cell density bioreactors. The centrifugal bioreactor (CCBR) retains cells by balancing settling forces with surface drag forces due to medium throughput and is capable of maintaining cell densities above 10(8) cells/mL. This article builds on a previous study where the fluid mechanics of an empty CCBR were investigated showing fluid flow is nonuniform and dominated by Coriolis forces, raising concerns about nutrient and cell distribution. In this article, we demonstrate that the previously reported Coriolis forces are still present in the CCBR, but masked by the presence of cells. Experimental dye injection observations during culture of 15 microm hybridoma cells show a continual uniform darkening of the cell bed, indicating the region of the reactor containing cells is well mixed. Simulation results also indicate the cell bed is well mixed during culture of mammalian cells ranging in size from 10 to 20 microm. However, simulations also allow for a slight concentration gradient to be identified and attributed to Coriolis forces. Experimental results show cell density increases from 0.16 to 0.26 when centrifugal force is doubled by increasing RPM from 650 to 920 at a constant inlet velocity of 6.5 cm/s; an effect also observed in the simulation. Results presented in this article indicate cells maintained in the CCBR behave as a high-density fluidized bed of cells providing a homogeneous environment to ensure optimal growth conditions.


Figures

Figure 1
Figure 1. Process flow diagram of the system used to visualize movement of fluid throughout the CCBR (A). Pumps were used to move either undyed PBS (B) or BPB dyed PBS (C) from a reservoir to the reactor. Inoculation line (D) and valve (E) were used to introduce cells into the system, whereas valves (F) and (G) were used to recycle reactor effluent or direct the effluent to waste (H)
During reactor operation, system rotation and fluid movement provided cells with centrifugal force opposed by buoyant and drag forces; when these forces are balanced cells are immobilized in the reactor. Important reactor dimensions needed in numerical simulations are also provided.
Figure 2
Figure 2. The progressive development of a fluidized bed of cells beginning with 5 × 3 108 cells/mL evenly distributed throughout the reactor chamber and recycle loop (A)
Cells begin to settle into the opaque cell bed in the lower half of the chamber (B) due to the balanced centrifugal and drag forces from CCBR operation at 650 RPM and an inlet velocity of 6.5 cm/s. At steady state, the region above the cell bed will become clear as all cells will be retained in a well-defined fluidized bed of cells.
Figure 3
Figure 3. Steady-state operation of the CCBR at a constant inlet velocity of 6.5 cm/s at a RPM of 650 (A) and 920 (B)
The centrifugal and drag forces are at a balanced equilibrium (A) resulting in a cell bed volume of 5.5 mL and a cell density of 9.1 × 10⁷ cells/mL. Increasing the RPM to 920 (B) doubles the centrifugal force, requiring a new equilibrium between the centrifugal and drag forces to be reached. As a result the cell bed volume is decreased to 3.4 mL and density is increased to 1.5 × 10⁸ cells/mL.
Figure 4
Figure 4. Before any dye injection (A) the steady-state result at 650 RPM and an inlet velocity of 6.5 cm/s shows a sharp interface between the opaque cell bed and the cell free clear fluid above
The darkened region indicated with the arrow (A) is not the presence of a dye gradient, but is a population of dead cells dyed with BPB. The cell bed continually darkens as BPB is supplied to the system, observed at 40 s (B) and 80 s (C) after dye injection begins. Uniform darkening of the cell bed indicates cells are retained in a region which is well mixed.
Figure 5
Figure 5. Observed at the interface separating the top of the cell bed from the PBS above is the presence of Rayleigh-Taylor (RT) instabilities
RT instabilities result from the nonuniform acceleration of a more dense fluid into a less dense fluid, when the two fluids are separated by a sharp interface. Previous results have shown the addition of BPB to a dilute salt solution decreases solution density. Therefore, the observed RT instabilities are an artifact of the dye injection procedure used to visualize the flow profile and would not be present during cell culture with a homogeneous culture medium.
Figure 6
Figure 6. Cell volume fractions at various RPM and a constant inlet velocity of 6.5 cm/s are shown
Experimental cell volume fractions of 0.16 and 0.26 at 650 and 920 RPM were determined assuming a cell bed of uniform density and a volume calculated from still photographs. Simulation results along the reactor centerline indicate similar maximum cell volume fractions of 0.15 and 0.22 for RPMs of 650 and 920, respectively. The diffuse interface at the top of the cell bed in numerical results can be attributed to artificial diffusion, while a constant maximum cell volume fraction is not predicted in simulations due to the accumulation of cells along the right wall of the reactor.
Figure 7
Figure 7. An increasing density of cells across a reactor cross section reaching a maximum at the right reactor wall indicates a region of increased cell concentration
The gray shaded area in panel (A) corresponds to the x–y plane at z = 0 and the volume fraction along each horizontal line is shown in panel (B). Accumulation of cells along the right-side wall of the reactor suggests a preferential flow along the opposite wall. The left wall of the reactor is the same wall along which the majority of fluid flow is observed during CCBR operation in the absence of cells.
Figure 8
Figure 8. At constant reactor settings of 650 RPM and an inlet velocity of 6.5 cm/s, the effect of cell size on cell volume fraction distribution throughout the reactor is shown for 5 × 3 108 total cells
As the diameter of a cell is decreased from 20 μm to 10 μm, the maximum cell volume fraction decreases from 0.22 to 0.10 while cells become more dispersed throughout the entire reactor making cell retention difficult. These effects are due to the fact that as cell size is decreased the magnitude of the settling force decreases faster than the drag force indicating reactor settings must be carefully tuned for each cell type and desired culture density.

Similar articles

Cited by

References

    1. Landry Y, Gies JP. Drugs and their molecular targets: an updated overview. Fundam Clin Pharmacol. 2008;22:1–18. - PubMed
    1. Migliore C, Giordano S. Molecular cancer therapy: can our expectation be MET? Eur J Cancer. 2008;44:641–651. - PubMed
    1. Kundu PK, Prasad NS, Electricwala SE, Varma R, Datta D. Getting higher yields of monoclonal antibody in culture. Indian J Physiol Pharmacol. 1998;42:155–171. - PubMed
    1. Werner RG. Economic aspects of commercial manufacture of biopharmaceuticals. J Biotechnol. 2004;113:171–182. - PubMed
    1. Tang YJ, Ohashi R, Hamel JF. Perfusion culture of hybridoma cells for hyperproduction of IgG(2a) monoclonal antibody in a wave bioreactor-perfusion culture system. Biotechnol Prog. 2007;23:255–264. - PubMed

Publication types