Catalytic ozonation-biological coupled processes for the treatment of industrial wastewater containing refractory chlorinated nitroaromatic compounds
- PMID: 20205304
- PMCID: PMC2833402
- DOI: 10.1631/jzus.B0900291
Catalytic ozonation-biological coupled processes for the treatment of industrial wastewater containing refractory chlorinated nitroaromatic compounds
Abstract
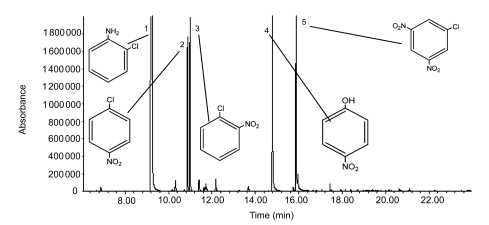
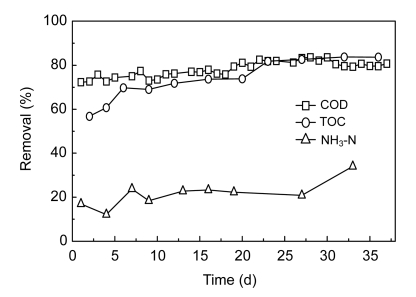
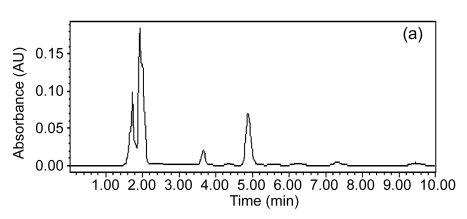
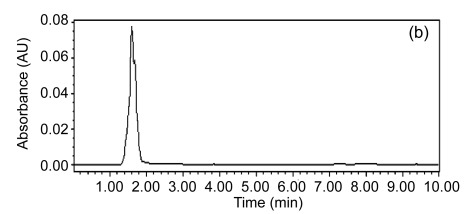
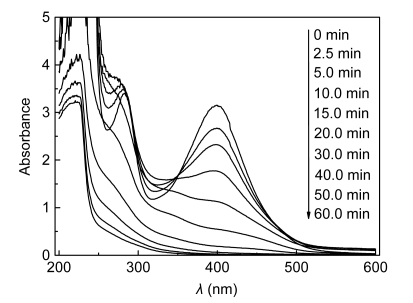
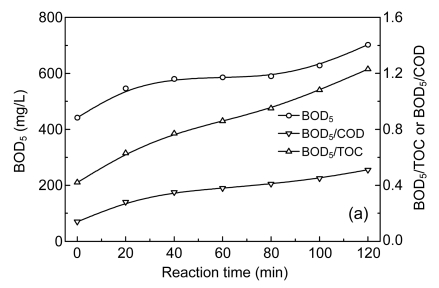
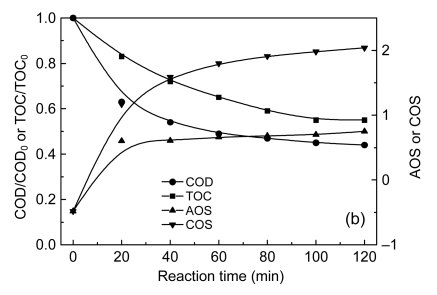
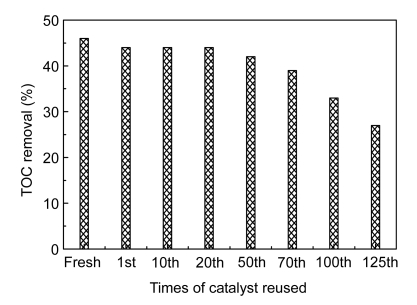
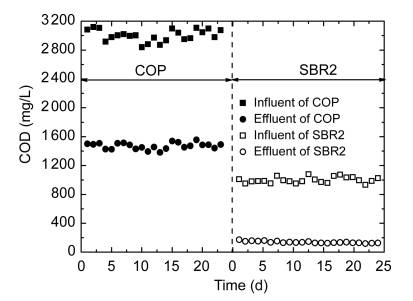
A treatability study of industrial wastewater containing chlorinated nitroaromatic compounds (CNACs) by a catalytic ozonation process (COP) with a modified Mn/Co ceramic catalyst and an aerobic sequencing batch reactor (SBR) was investigated. A preliminary attempt to treat the diluted wastewater with a single SBR resulted in ineffective removal of the color, ammonia, total organic carbon (TOC) and chemical oxygen demand (COD). Next, COP was applied as a pretreatment in order to obtain a bio-compatible wastewater for SBR treatment in a second step. The effectiveness of the COP pretreatment was assessed by evaluating wastewater biodegradability enhancement (the ratio of biology oxygen demand after 5 d (BOD(5)) to COD), as well as monitoring the evolution of TOC, carbon oxidation state (COS), average oxidation state (AOS), color, and major pollutant concentrations with reaction time. In the COP, the catalyst preserved its catalytic properties even after 70 reuse cycles, exhibiting good durability and stability. The performance of SBR to treat COP effluent was also examined. At an organic loading rate of 2.0 kg COD/(m(3)xd), with hydraulic retention time (HRT)=10 h and temperature (30+/-2) degrees C, the average removal efficiencies of NH(3)-N, COD, BOD(5), TOC, and color in a coupled COP/SBR process were about 80%, 95.8%, 93.8%, 97.6% and 99.3%, respectively, with average effluent concentrations of 10 mg/L, 128 mg/L, 27.5 mg/L, 25.0 mg/L, and 20 multiples, respectively, which were all consistent with the national standards for secondary discharge of industrial wastewater into a public sewerage system (GB 8978-1996). The results indicated that the coupling of COP with a biological process was proved to be a technically and economically effective method for treating industrial wastewater containing recalcitrant CNACs.
Figures
Similar articles
-
Upflow anaerobic sludge blanket reactor--a review.Indian J Environ Health. 2001 Apr;43(2):1-82. Indian J Environ Health. 2001. PMID: 12397675 Review.
-
The investigation of catalytic ozonation and integrated catalytic ozonation/biological processes for the removal of phenol from saline wastewaters.J Hazard Mater. 2009 Nov 15;171(1-3):175-81. doi: 10.1016/j.jhazmat.2009.05.113. Epub 2009 Jun 6. J Hazard Mater. 2009. PMID: 19560265
-
Combined chemical and biological oxidation of penicillin formulation effluent.J Environ Manage. 2004 Nov;73(2):155-63. doi: 10.1016/j.jenvman.2004.06.007. J Environ Manage. 2004. PMID: 15380320
-
Effect of bio-sludge concentration on the efficiency of sequencing batch reactor (SBR) system to treat wastewater containing Pb2+ and Ni2+.J Hazard Mater. 2009 Jul 15;166(1):356-64. doi: 10.1016/j.jhazmat.2008.11.023. Epub 2008 Nov 18. J Hazard Mater. 2009. PMID: 19097695
-
Evaluation of the persistence of transformation products from ozonation of trace organic compounds - a critical review.Water Res. 2015 Jan 1;68:150-70. doi: 10.1016/j.watres.2014.09.051. Water Res. 2015. PMID: 25462725 Review.
Cited by
-
Metabolism of 2-chloro-4-nitrophenol in a gram negative bacterium, Burkholderia sp. RKJ 800.PLoS One. 2012;7(6):e38676. doi: 10.1371/journal.pone.0038676. Epub 2012 Jun 6. PLoS One. 2012. PMID: 22701692 Free PMC article.
-
Contrasting roles of phenol and pyrocatechol on the degradation of 4-chlorophenol in a photocatalytic-biological reactor.Environ Sci Pollut Res Int. 2017 Nov;24(31):24725-24731. doi: 10.1007/s11356-017-0245-2. Epub 2017 Sep 24. Environ Sci Pollut Res Int. 2017. PMID: 28942472
-
A Recently Assembled Degradation Pathway for 2,3-Dichloronitrobenzene in Diaphorobacter sp. Strain JS3051.mBio. 2021 Aug 31;12(4):e0223121. doi: 10.1128/mBio.02231-21. Epub 2021 Aug 24. mBio. 2021. PMID: 34425699 Free PMC article.
-
Pathway for degradation of 2-chloro-4-nitrophenol in Arthrobacter sp. SJCon.Curr Microbiol. 2011 Dec;63(6):568-73. doi: 10.1007/s00284-011-0022-2. Epub 2011 Sep 30. Curr Microbiol. 2011. PMID: 21960016
References
-
- Amat AM, Arques A, Galindo F, Miranda MA, Santos-Juanes L, Vercher RF, Vicente R. Acridine yellow as solar photocatalyst for enhancing biodegradability and eliminating ferulic acid as model pollutant. Appl Catal B-Environ. 2007;73(3-4):220–226. doi: 10.1016/j.apcatb.2006.12.003. - DOI
-
- APHA/AWWA/WEF. Standard Methods for the Examination of Water and Wastewater. 20th Ed. Washington DC, USA: American Public Health Association/American Water Works Association/Water Environment Federation; 1998.
-
- Beltrán FJ, Encinar JM, Alonso MA. Nitroaromatic hydrocarbon ozonation in water. 1. Single ozonation. Ind Eng Chem Res. 1998;37(1):25–31. doi: 10.1021/ie9704253. - DOI
-
- Beltrán FJ, García-Araya JF, Frades J, Álvarez P, Gimeno O. Effects of single and combined ozonation with hydrogen peroxide or UV radiation on the chemical degradation and biodegradability of debittering table olive industrial wastewaters. Water Res. 1999;33(3):723–732. doi: 10.1016/S0043-1354(98)00239-5. - DOI
MeSH terms
Substances
LinkOut - more resources
Full Text Sources
Other Literature Sources
Medical