. 2010 Mar;11(3):200-8.
doi: 10.1631/jzus.B0900074.

Effects of moniliformin and selenium on human articular cartilage metabolism and their potential relationships to the pathogenesis of Kashin-Beck disease

Affiliations

Effects of moniliformin and selenium on human articular cartilage metabolism and their potential relationships to the pathogenesis of Kashin-Beck disease

An Zhang et al. J Zhejiang Univ Sci B. 2010 Mar.

Abstract

Objective: To investigate the effects of mycotoxin moniliformin (MON) on the metabolism of aggrecan and type II collagen in human chondrocytes in vitro and the relationship between MON and Kashin-Beck disease (KBD).

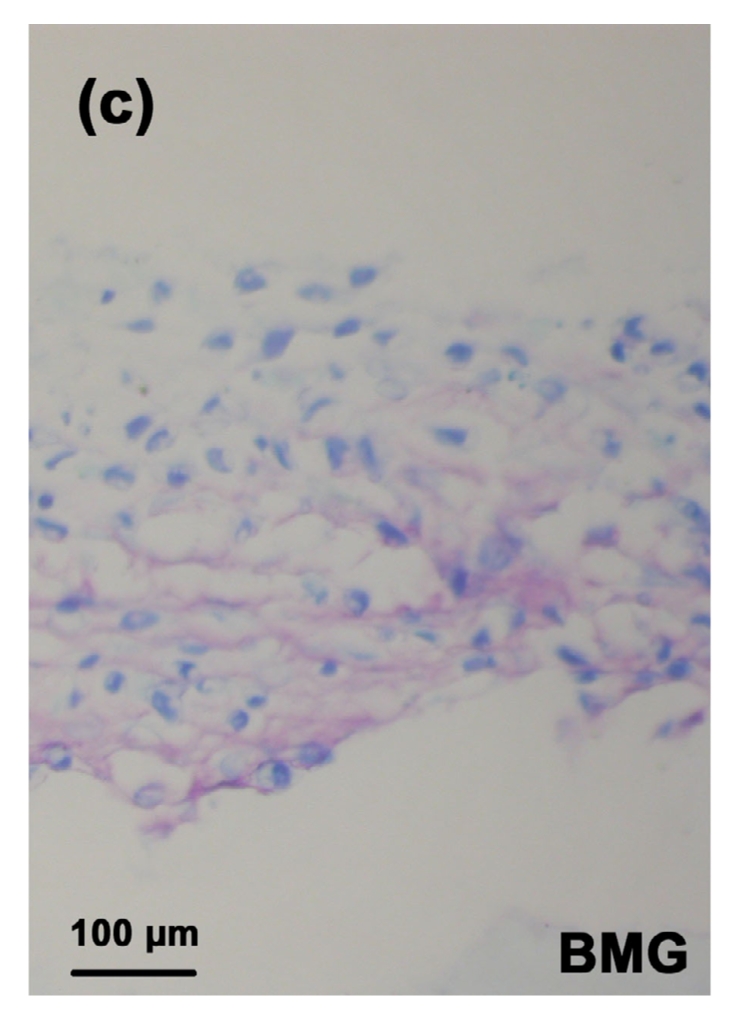
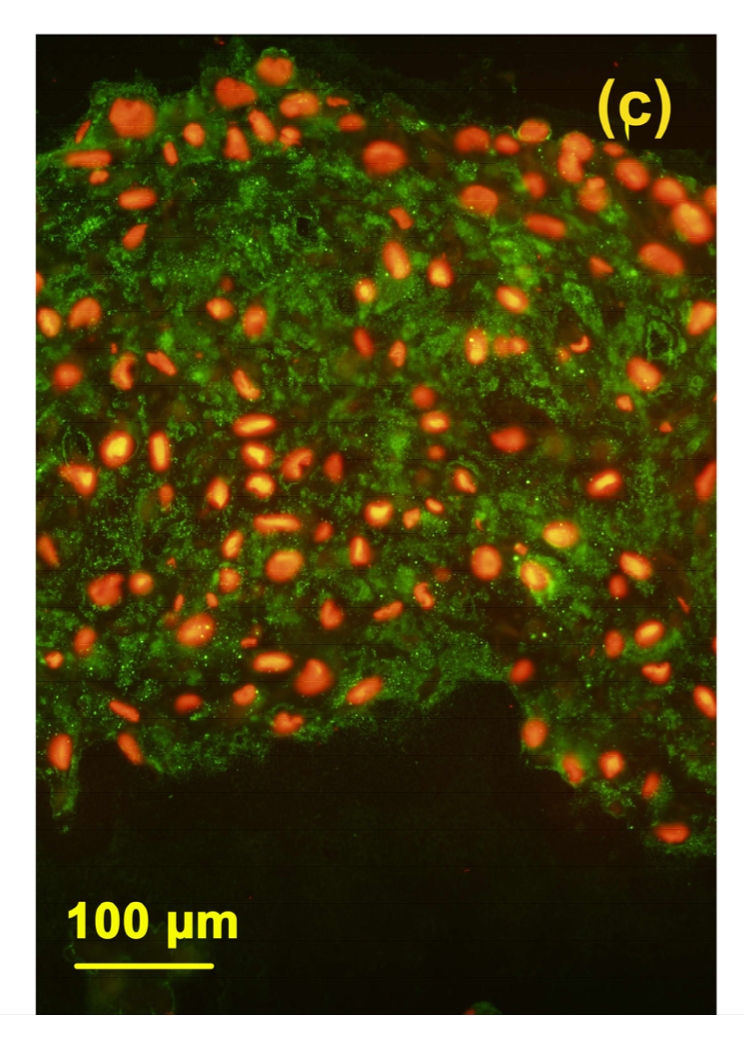
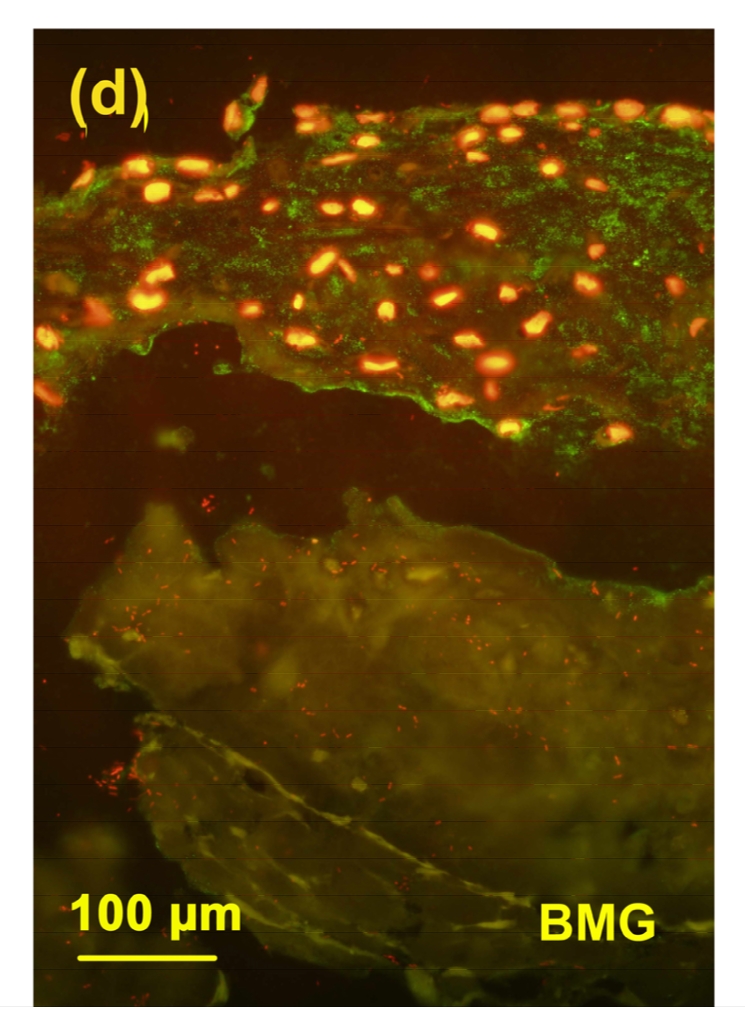
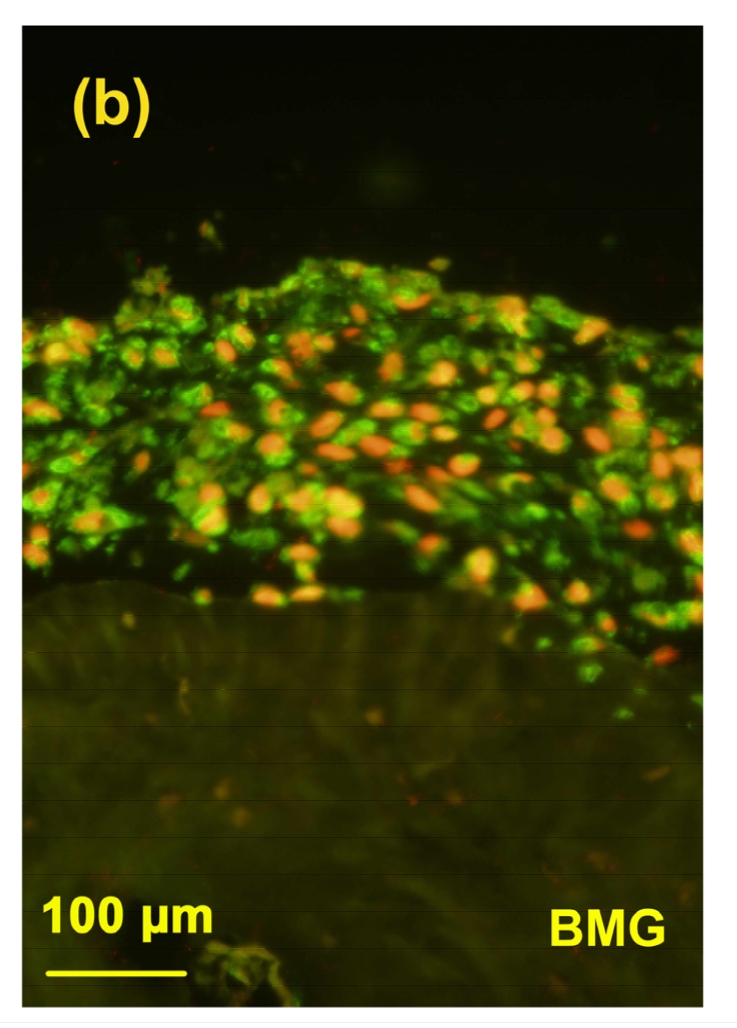
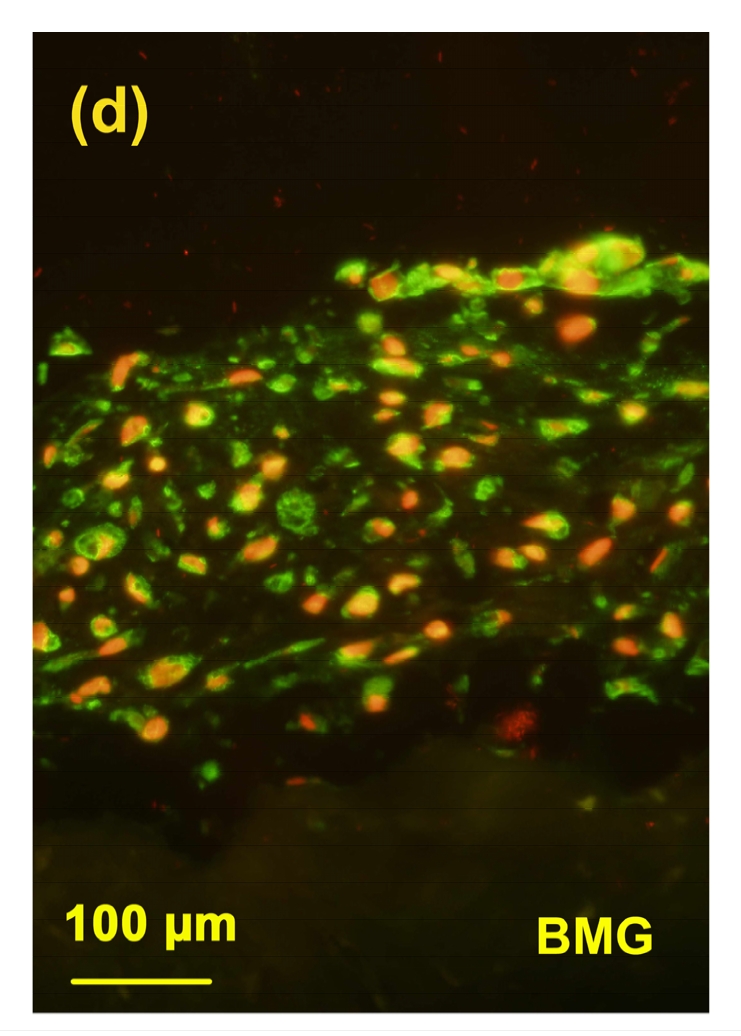
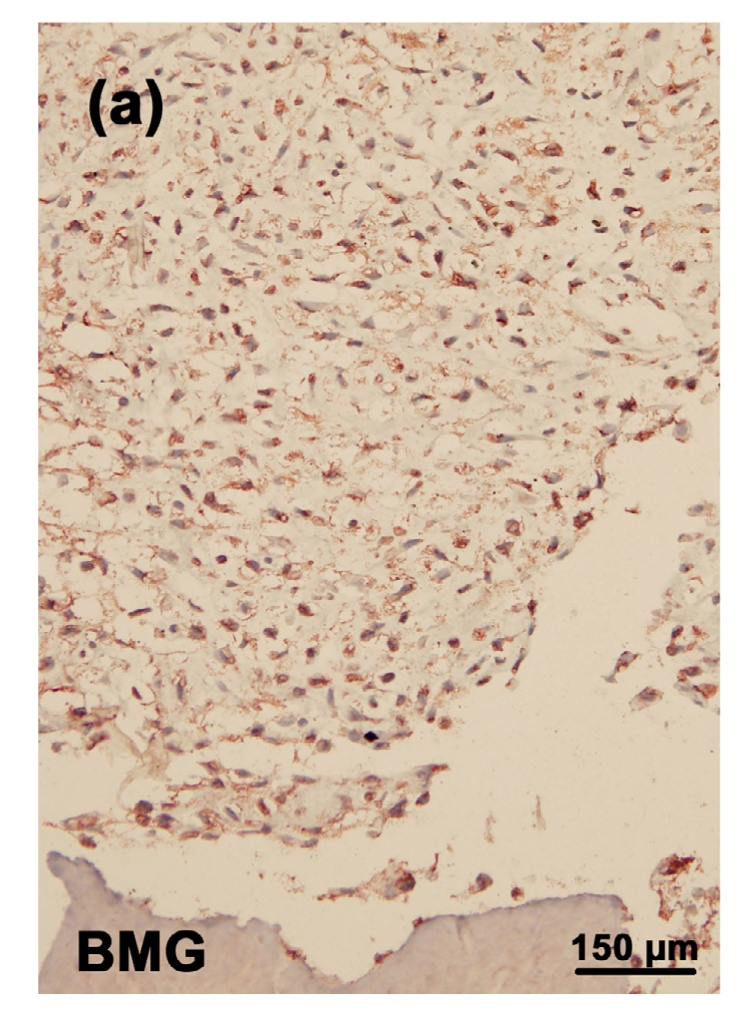
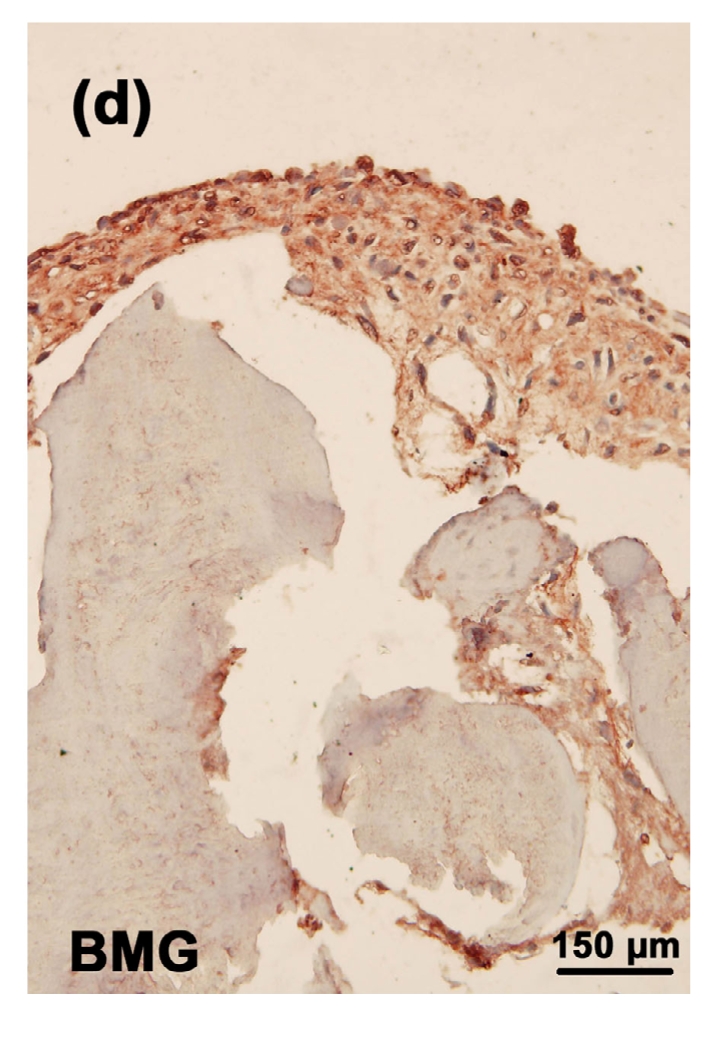
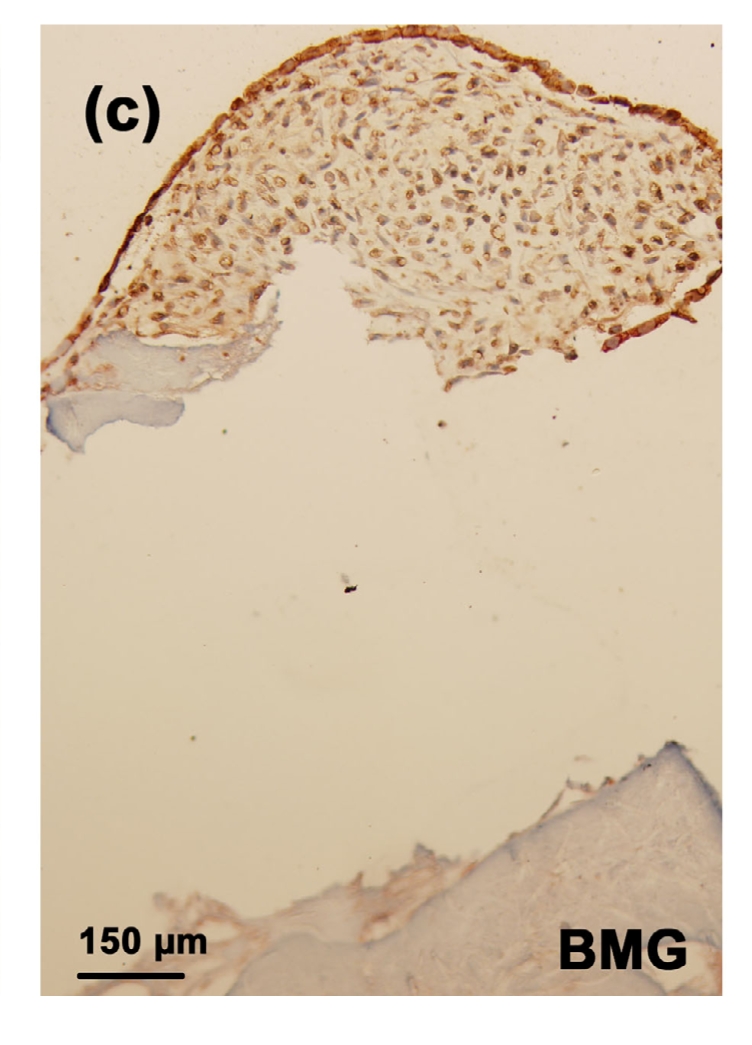
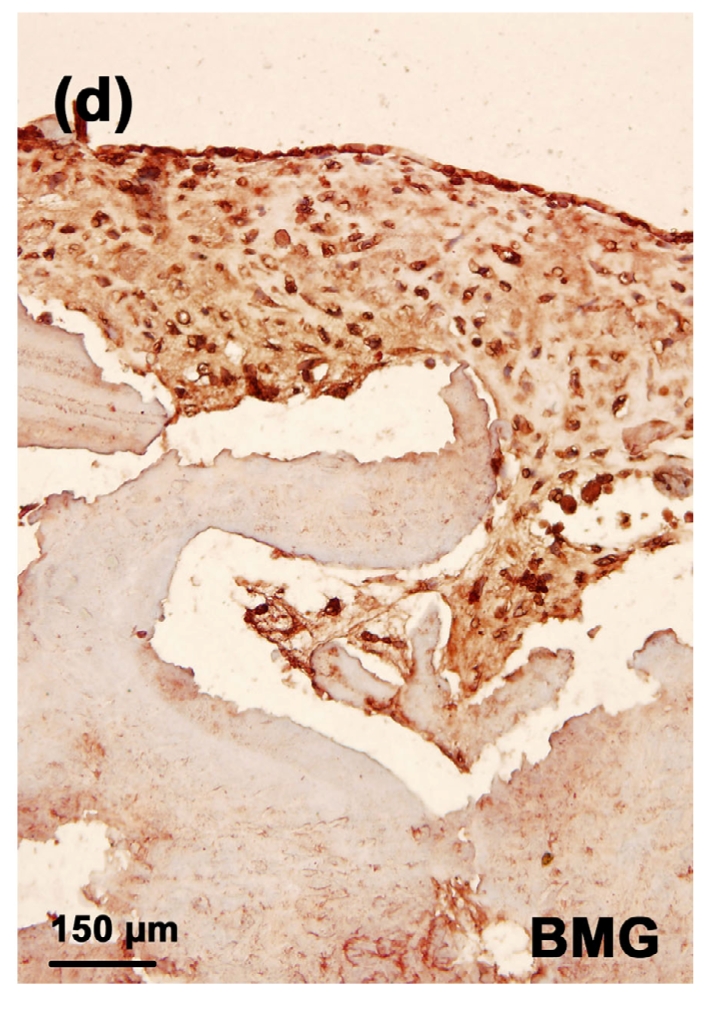
Methods: Human chondrocytes were isolated and cultured on bone matrix gelatin to form an artificial cartilage model in vitro with or without MON toxin. Cell viability was determined by 3-(4,5-dimethylthiazol-2-yl)-2,5-diphenyltetrazolium bromide (MTT) assay. The expression of aggrecan and type II collagen in the cartilage was determined using immunocytochemical staining.

Results: MON toxin inhibited chondrocyte viability in dose-dependent and time-dependent manners. MON reduced aggrecan and type II collagen syntheses in the tissue-engineered cartilage. MON also increased the expression of matrix metalloproteinase-1 (MMP-1), MMP-13, BC4 epitopes, and CD44 in cartilages. However, the expression of 3B3(-) epitopes in cartilages was inhibited by MON. Selenium partially alleviated the damage of aggrecan induced by MON toxin.

Conclusion: MON toxin promoted the catabolism of aggrecan and type II collagen in human chondrocytes.


Figures

Fig. 1
Fig. 1
Effects of different concentrations of MON on the cell viability of chondrocytes Human chondrocytes cultured as monolayer were incubated with different concentrations of MON toxin for 5 d. MTT assay was done to determine the cell viability. The cellular viability of control is regarded as 1. Data are the mean of the experiment (n=5). * P≤0.05 when compared with the control group
Fig. 2
Fig. 2
H & E staining of the chondrocytes cultured on BMG Human chondrocytes were cultured on BMG for 16 d. (a) Control group; (b) MON group; (c) Control+Se group; (d) MON+Se group. Black arrow: cell necrosis
Fig. 2
Fig. 2
H & E staining of the chondrocytes cultured on BMG Human chondrocytes were cultured on BMG for 16 d. (a) Control group; (b) MON group; (c) Control+Se group; (d) MON+Se group. Black arrow: cell necrosis
Fig. 2
Fig. 2
H & E staining of the chondrocytes cultured on BMG Human chondrocytes were cultured on BMG for 16 d. (a) Control group; (b) MON group; (c) Control+Se group; (d) MON+Se group. Black arrow: cell necrosis
Fig. 2
Fig. 2
H & E staining of the chondrocytes cultured on BMG Human chondrocytes were cultured on BMG for 16 d. (a) Control group; (b) MON group; (c) Control+Se group; (d) MON+Se group. Black arrow: cell necrosis
Fig. 3
Fig. 3
TB staining of the cartilage reconstructed in vitro Chondrocytes were cultured for 16 d after seeded on BMG. Proteoglycan were stained with purple and the nuclei were stained with blue. (a) Control group; (b) MON group; (c) Control+Se group; (d) MON+Se group
Fig. 3
Fig. 3
TB staining of the cartilage reconstructed in vitro Chondrocytes were cultured for 16 d after seeded on BMG. Proteoglycan were stained with purple and the nuclei were stained with blue. (a) Control group; (b) MON group; (c) Control+Se group; (d) MON+Se group
Fig. 3
Fig. 3
TB staining of the cartilage reconstructed in vitro Chondrocytes were cultured for 16 d after seeded on BMG. Proteoglycan were stained with purple and the nuclei were stained with blue. (a) Control group; (b) MON group; (c) Control+Se group; (d) MON+Se group
Fig. 3
Fig. 3
TB staining of the cartilage reconstructed in vitro Chondrocytes were cultured for 16 d after seeded on BMG. Proteoglycan were stained with purple and the nuclei were stained with blue. (a) Control group; (b) MON group; (c) Control+Se group; (d) MON+Se group
Fig. 4
Fig. 4
Immunostaining of type II collagen in the cartilage reconstructed in vitro Chondrocytes were cultured for 16 d before the immunostaining. The type II collagen was deep brownish red and the nuclei were blue. (a) Control group; (b) MON group; (c) Control+Se group; (d) MON+Se group
Fig. 4
Fig. 4
Immunostaining of type II collagen in the cartilage reconstructed in vitro Chondrocytes were cultured for 16 d before the immunostaining. The type II collagen was deep brownish red and the nuclei were blue. (a) Control group; (b) MON group; (c) Control+Se group; (d) MON+Se group
Fig. 4
Fig. 4
Immunostaining of type II collagen in the cartilage reconstructed in vitro Chondrocytes were cultured for 16 d before the immunostaining. The type II collagen was deep brownish red and the nuclei were blue. (a) Control group; (b) MON group; (c) Control+Se group; (d) MON+Se group
Fig. 4
Fig. 4
Immunostaining of type II collagen in the cartilage reconstructed in vitro Chondrocytes were cultured for 16 d before the immunostaining. The type II collagen was deep brownish red and the nuclei were blue. (a) Control group; (b) MON group; (c) Control+Se group; (d) MON+Se group
Fig. 5
Fig. 5
Immunostaining of 3B3(−) in the cartilage reconstructed in vitro Chondrocytes were cultured for 16 d before the immunostaining. The epitopes of 3B3(−) were green and the nuclei were red. (a) Control group; (b) MON group; (c) Control+Se group; (d) MON+Se group
Fig. 5
Fig. 5
Immunostaining of 3B3(−) in the cartilage reconstructed in vitro Chondrocytes were cultured for 16 d before the immunostaining. The epitopes of 3B3(−) were green and the nuclei were red. (a) Control group; (b) MON group; (c) Control+Se group; (d) MON+Se group
Fig. 5
Fig. 5
Immunostaining of 3B3(−) in the cartilage reconstructed in vitro Chondrocytes were cultured for 16 d before the immunostaining. The epitopes of 3B3(−) were green and the nuclei were red. (a) Control group; (b) MON group; (c) Control+Se group; (d) MON+Se group
Fig. 5
Fig. 5
Immunostaining of 3B3(−) in the cartilage reconstructed in vitro Chondrocytes were cultured for 16 d before the immunostaining. The epitopes of 3B3(−) were green and the nuclei were red. (a) Control group; (b) MON group; (c) Control+Se group; (d) MON+Se group
Fig. 6
Fig. 6
Immunostaining of BC4 epitopes in the cartilage reconstructed in vitro Chondrocytes were cultured for 16 d after seeded on BMG. The epitopes of BC4 were green and the nuclei were red. (a) Control group; (b) MON group; (c) Control+Se group; (d) MON+Se group
Fig. 6
Fig. 6
Immunostaining of BC4 epitopes in the cartilage reconstructed in vitro Chondrocytes were cultured for 16 d after seeded on BMG. The epitopes of BC4 were green and the nuclei were red. (a) Control group; (b) MON group; (c) Control+Se group; (d) MON+Se group
Fig. 6
Fig. 6
Immunostaining of BC4 epitopes in the cartilage reconstructed in vitro Chondrocytes were cultured for 16 d after seeded on BMG. The epitopes of BC4 were green and the nuclei were red. (a) Control group; (b) MON group; (c) Control+Se group; (d) MON+Se group
Fig. 6
Fig. 6
Immunostaining of BC4 epitopes in the cartilage reconstructed in vitro Chondrocytes were cultured for 16 d after seeded on BMG. The epitopes of BC4 were green and the nuclei were red. (a) Control group; (b) MON group; (c) Control+Se group; (d) MON+Se group
Fig. 7
Fig. 7
Immunostaining of MMP-1 in the cartilage reconstructed in vitro Chondrocytes were cultured for 16 d before the immunostaining. MMP-1 was deep brownish red and the nuclei were blue. (a) Control group; (b) MON group; (c) Control+Se group; (d) MON+Se group
Fig. 7
Fig. 7
Immunostaining of MMP-1 in the cartilage reconstructed in vitro Chondrocytes were cultured for 16 d before the immunostaining. MMP-1 was deep brownish red and the nuclei were blue. (a) Control group; (b) MON group; (c) Control+Se group; (d) MON+Se group
Fig. 7
Fig. 7
Immunostaining of MMP-1 in the cartilage reconstructed in vitro Chondrocytes were cultured for 16 d before the immunostaining. MMP-1 was deep brownish red and the nuclei were blue. (a) Control group; (b) MON group; (c) Control+Se group; (d) MON+Se group
Fig. 7
Fig. 7
Immunostaining of MMP-1 in the cartilage reconstructed in vitro Chondrocytes were cultured for 16 d before the immunostaining. MMP-1 was deep brownish red and the nuclei were blue. (a) Control group; (b) MON group; (c) Control+Se group; (d) MON+Se group
Fig. 8
Fig. 8
Immunostaining of MMP13 in the cartilage reconstructed in vitro Chondrocytes were cultured for 16 d before the immunostaining. MMP-13 was deep brownish red and the nuclei were blue. (a) Control group; (b) MON group; (c) Control+Se group; (d) MON+Se group
Fig. 8
Fig. 8
Immunostaining of MMP13 in the cartilage reconstructed in vitro Chondrocytes were cultured for 16 d before the immunostaining. MMP-13 was deep brownish red and the nuclei were blue. (a) Control group; (b) MON group; (c) Control+Se group; (d) MON+Se group
Fig. 8
Fig. 8
Immunostaining of MMP13 in the cartilage reconstructed in vitro Chondrocytes were cultured for 16 d before the immunostaining. MMP-13 was deep brownish red and the nuclei were blue. (a) Control group; (b) MON group; (c) Control+Se group; (d) MON+Se group
Fig. 8
Fig. 8
Immunostaining of MMP13 in the cartilage reconstructed in vitro Chondrocytes were cultured for 16 d before the immunostaining. MMP-13 was deep brownish red and the nuclei were blue. (a) Control group; (b) MON group; (c) Control+Se group; (d) MON+Se group
Fig. 9
Fig. 9
Immunostaining of CD44 in the cartilage reconstructed in vitro Chondrocytes were cultured for 16 d before the immunostaining. CD44 was deep brownish red and the nuclei were blue. (a) Control group; (b) MON group; (c) Control+Se group; (d) MON+Se group
Fig. 9
Fig. 9
Immunostaining of CD44 in the cartilage reconstructed in vitro Chondrocytes were cultured for 16 d before the immunostaining. CD44 was deep brownish red and the nuclei were blue. (a) Control group; (b) MON group; (c) Control+Se group; (d) MON+Se group
Fig. 9
Fig. 9
Immunostaining of CD44 in the cartilage reconstructed in vitro Chondrocytes were cultured for 16 d before the immunostaining. CD44 was deep brownish red and the nuclei were blue. (a) Control group; (b) MON group; (c) Control+Se group; (d) MON+Se group
Fig. 9
Fig. 9
Immunostaining of CD44 in the cartilage reconstructed in vitro Chondrocytes were cultured for 16 d before the immunostaining. CD44 was deep brownish red and the nuclei were blue. (a) Control group; (b) MON group; (c) Control+Se group; (d) MON+Se group

Similar articles

Cited by

References

    1. Aigner T, Stöve J. Collagens–major component of the physiological cartilage matrix, major target of cartilage degeneration, major tool in cartilage repair. Adv Drug Del Rev. 2003;55(12):1569–1593. doi: 10.1016/j.addr.2003.08.009. - DOI - PubMed
    1. Cao JL, Mo XY, Wang CY. Effects of selenium and zinc on the growth metabolism of cultured chondrocytes. Chin J Endemiol. 1994;14(10):628–630. (in Chinese)
    1. Cao JL, Zheng B, Zhang SY, Mo DX. The experimental study of moniliformin effects on the chondrocytes. Endemic Dis Bull. 1995;10(4):5–7. (in Chinese)
    1. Cao JL, Zhang A, Yang B, Zhang ZT, Fu Q, Hughes CE, Caterson B. The effect of fungal moniliformin toxin and selenium supplementation on cartilage metabolism in vitro. Osteoarthritis and Cartilage. 2007;15(Suppl. 3):C108. doi: 10.1016/S1063-4584(07)61815-9. - DOI
    1. Cao JL, Li S, Shi Z, Yue Y, Sun J, Chen J, Fu Q, Hughes CE, Caterson B. Articular cartilage metabolism in patients with Kashin-Beck disease: an endemic osteoarthropathy in China. Osteoarthritis and Cartilage. 2008;16(6):680–688. doi: 10.1016/j.joca.2007.09.002. - DOI - PubMed

Publication types

MeSH terms