. 2010 Mar;11(3):221-6.
doi: 10.1631/jzus.B0900351.

Science letters: Proteomic analysis of differentially expressed proteins in mice with concanavalin A-induced hepatitis

Affiliations

Science letters: Proteomic analysis of differentially expressed proteins in mice with concanavalin A-induced hepatitis

Xu-fei Tan et al. J Zhejiang Univ Sci B. 2010 Mar.

Abstract

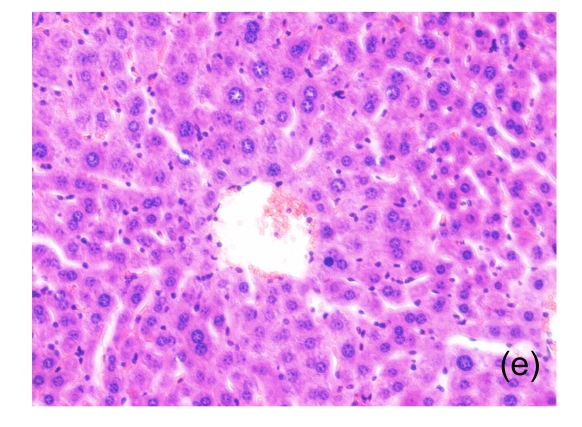
Objective: To find new protein biomarkers for the detection and evaluation of liver injury and to analyze the relationship between such proteins and disease progression in concanavalin A (Con A)-induced hepatitis.

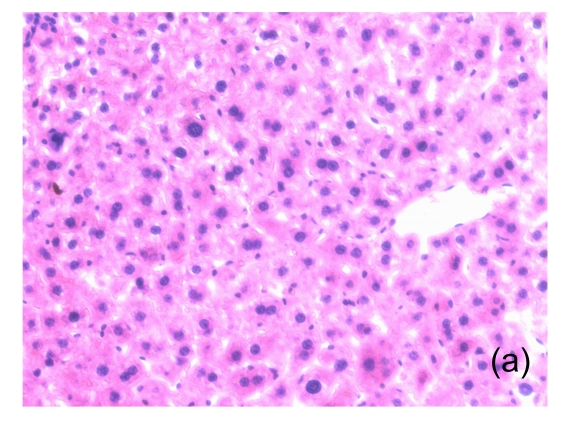
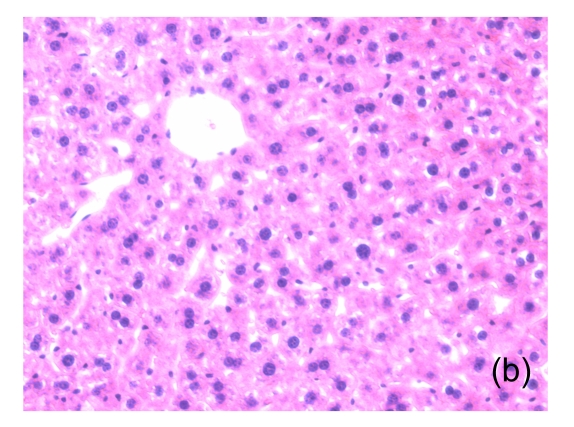
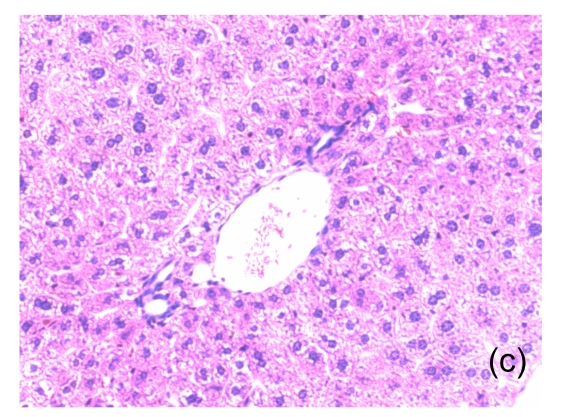
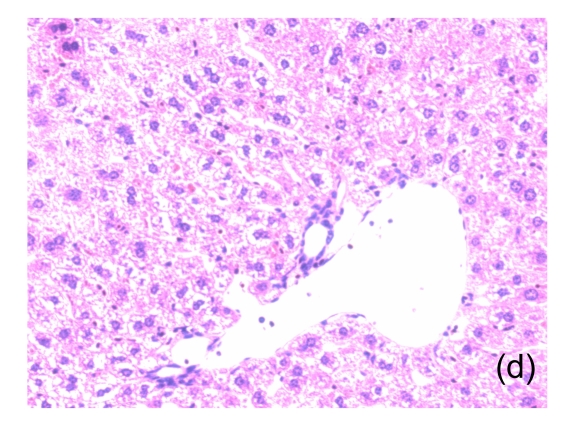
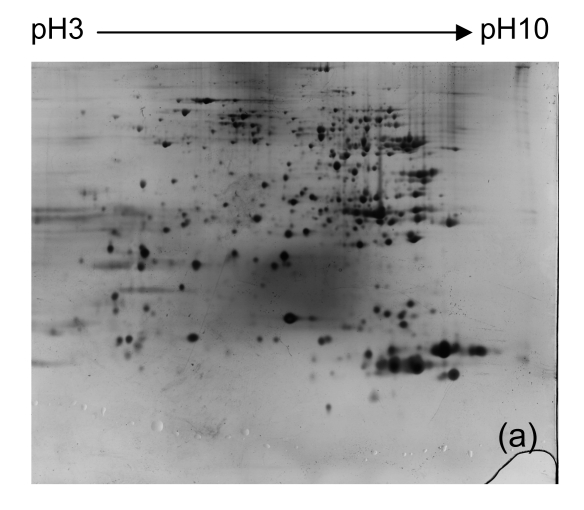
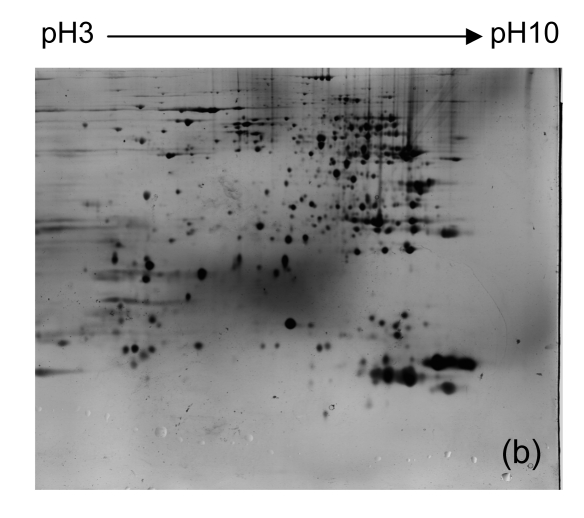
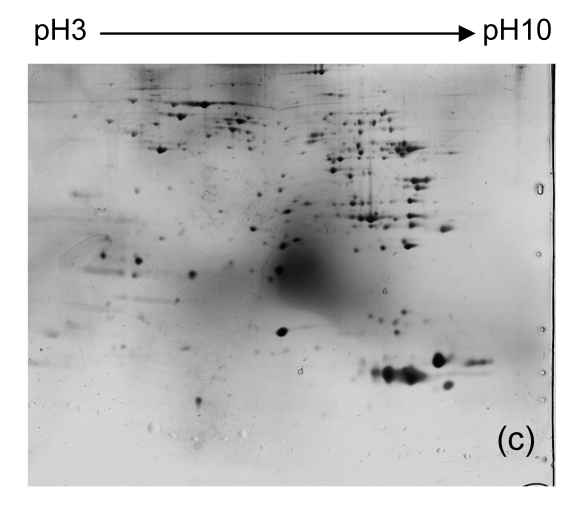
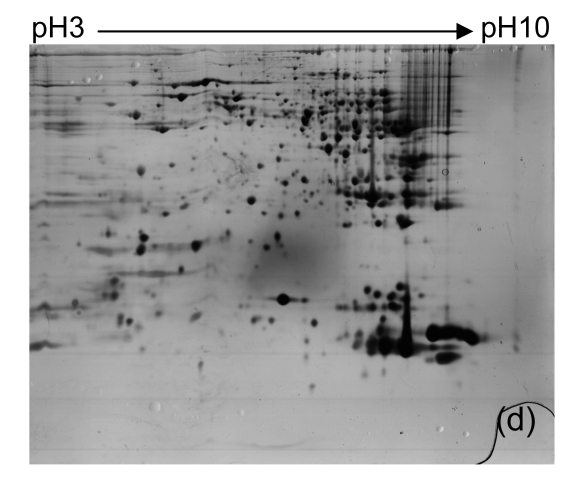
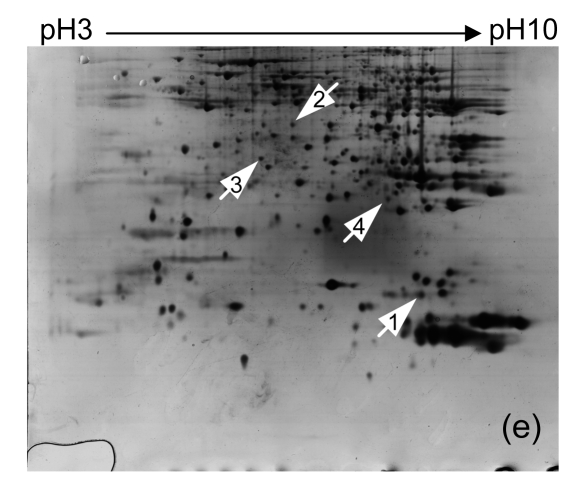
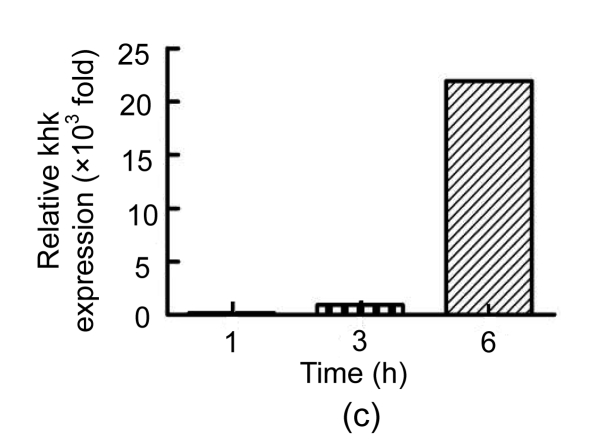
Methods: Twenty-five mice were randomly divided into five groups: an untreated group, a control group injected with phosphate buffered saline (PBS), and groups with Con A-induced hepatitis evaluated at 1, 3 and 6 h. Two-dimensional gel electrophoresis (2-DE) and mass spectrometry (MS) were used to identify differences in protein expression among groups. Quantitative real-time polymerase chain reaction (qRT-PCR) was performed to verify the results.

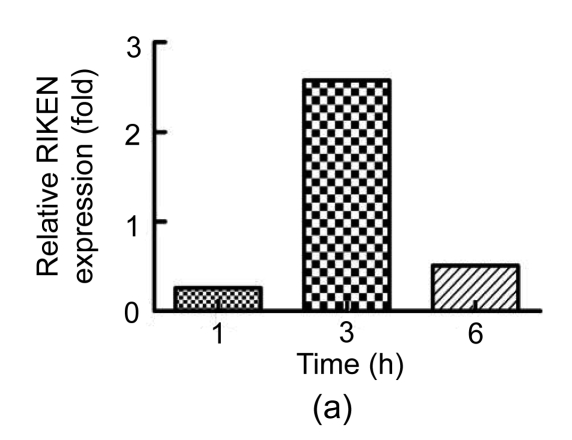
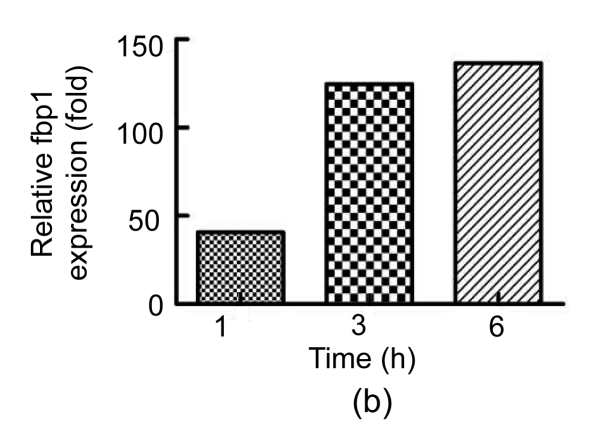
Results: In mice with Con A-induced hepatitis, expression levels of four proteins were increased: RIKEN, fructose bisphosphatase 1 (fbp1), ketohexokinase (khk), and Chain A of class pi glutathione S-transferase. Changes in fbp1 and khk were confirmed by qRT-PCR.

Conclusion: Levels of two proteins, fbp1 and khk, are clearly up-regulated in mice with Con A-induced hepatitis.


Figures

Fig. 1
Fig. 1
Microscopic appearance of the liver in mice representative of each group (a) Untreated mice; (b) PBS-treated mice; (c) 1 h after injecting Con A intravenously; (d) 3 h after injecting Con A intravenously (note a small amount of hepatocyte swelling); (e) 6 h after injecting Con A intravenously (note severe hepatocyte swelling and necrosis)
Fig. 1
Fig. 1
Microscopic appearance of the liver in mice representative of each group (a) Untreated mice; (b) PBS-treated mice; (c) 1 h after injecting Con A intravenously; (d) 3 h after injecting Con A intravenously (note a small amount of hepatocyte swelling); (e) 6 h after injecting Con A intravenously (note severe hepatocyte swelling and necrosis)
Fig. 2
Fig. 2
Representative 2-DE maps of liver proteins from samples from each group of mice. In the first dimension of electrophoresis, 200 μg protein was loaded on strips (240 mm, pH 3–10 non-linear); the second dimension of electrophoresis was a vertical 12.5% (w/v) SDS-PAGE (a) Untreated controls; (b) PBS controls; (c)–(e) 1, 3, and 6 h after injecting Con A intravenously, respectively
Fig. 2
Fig. 2
Representative 2-DE maps of liver proteins from samples from each group of mice. In the first dimension of electrophoresis, 200 μg protein was loaded on strips (240 mm, pH 3–10 non-linear); the second dimension of electrophoresis was a vertical 12.5% (w/v) SDS-PAGE (a) Untreated controls; (b) PBS controls; (c)–(e) 1, 3, and 6 h after injecting Con A intravenously, respectively
Fig. 3
Fig. 3
qRT-PCR analysis of selected proteins Relative expression of (a) RIKEN, (b) fbp1, and (c) khk at 1, 3 and 6 h after Con A injection compared with the levels in untreated controls
Fig. 3
Fig. 3
qRT-PCR analysis of selected proteins Relative expression of (a) RIKEN, (b) fbp1, and (c) khk at 1, 3 and 6 h after Con A injection compared with the levels in untreated controls
Fig. 3
Fig. 3
qRT-PCR analysis of selected proteins Relative expression of (a) RIKEN, (b) fbp1, and (c) khk at 1, 3 and 6 h after Con A injection compared with the levels in untreated controls

Similar articles

Cited by

References

    1. Bodzon-Kulakowska A, Bierczynska-Krzysik A, Dylag T, Drabik A, Suder P, Noga M, Jarzebinska J, Silberring J. Methods for samples preparation in proteomic research. J Chromatogr B. 2007;849(1-2):1–31. doi: 10.1016/j.jchromb.2006.10.040. - DOI - PubMed
    1. Bonthron DT, Brady N, Donaldson IA, Steinmann B. Molecular basis of essential fructosuria: molecular cloning and mutational analysis of human ketohexokinase (fructokinase) Hum Mol Genet. 1994;3(9):1627–1631. doi: 10.1093/hmg/3.9.1627. - DOI - PubMed
    1. Cuesta E, Boada J, Calafell R, Perales JC, Roig T, Bermudez J. Fructose 1,6-bisphosphate prevented endotoxemia, macrophage activation, and liver injury induced by D-galactosamine in rats. Crit Care Med. 2006;34(3):807–814. doi: 10.1097/01.CCM.0000202016.60856.03. - DOI - PubMed
    1. Dominguez DC, Lopes R, Torres ML. Proteomics technology. Clin Lab Sci. 2007;20(4):239–244. - PubMed
    1. Duncan R, Bazar L, Michelotti G, Tomonaga T, Krutzsch H, Avigan M, Levens D. A sequence-specific, single-strand binding protein activates the far upstream element of c-myc and defines a new DNA-binding motif. Genes Dev. 1994;8(4):465–480. doi: 10.1101/gad.8.4.465. - DOI - PubMed

Publication types