. 2010 Apr 13;49(14):3191-202.
doi: 10.1021/bi100104e.

Role of lipid peroxidation in cellular responses to D,L-sulforaphane, a promising cancer chemopreventive agent

Affiliations

Role of lipid peroxidation in cellular responses to D,L-sulforaphane, a promising cancer chemopreventive agent

Rajendra Sharma et al. Biochemistry. .

Abstract

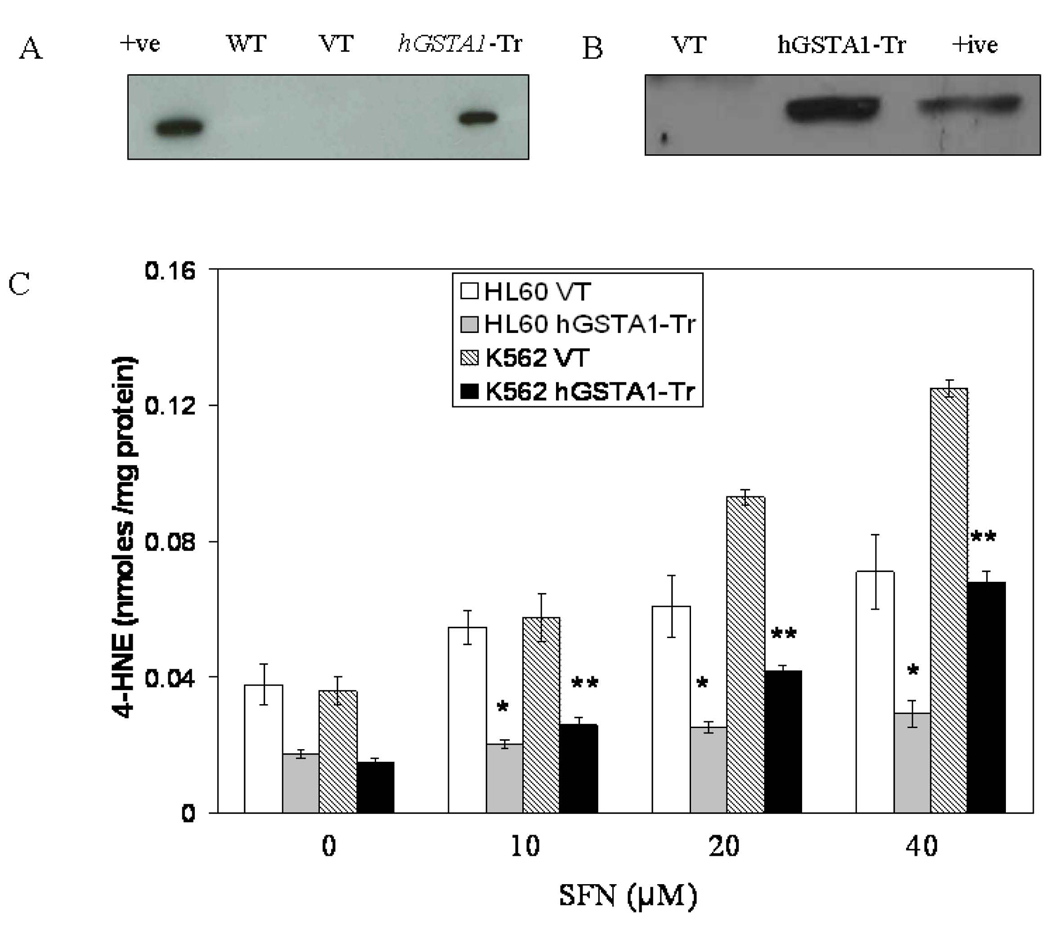
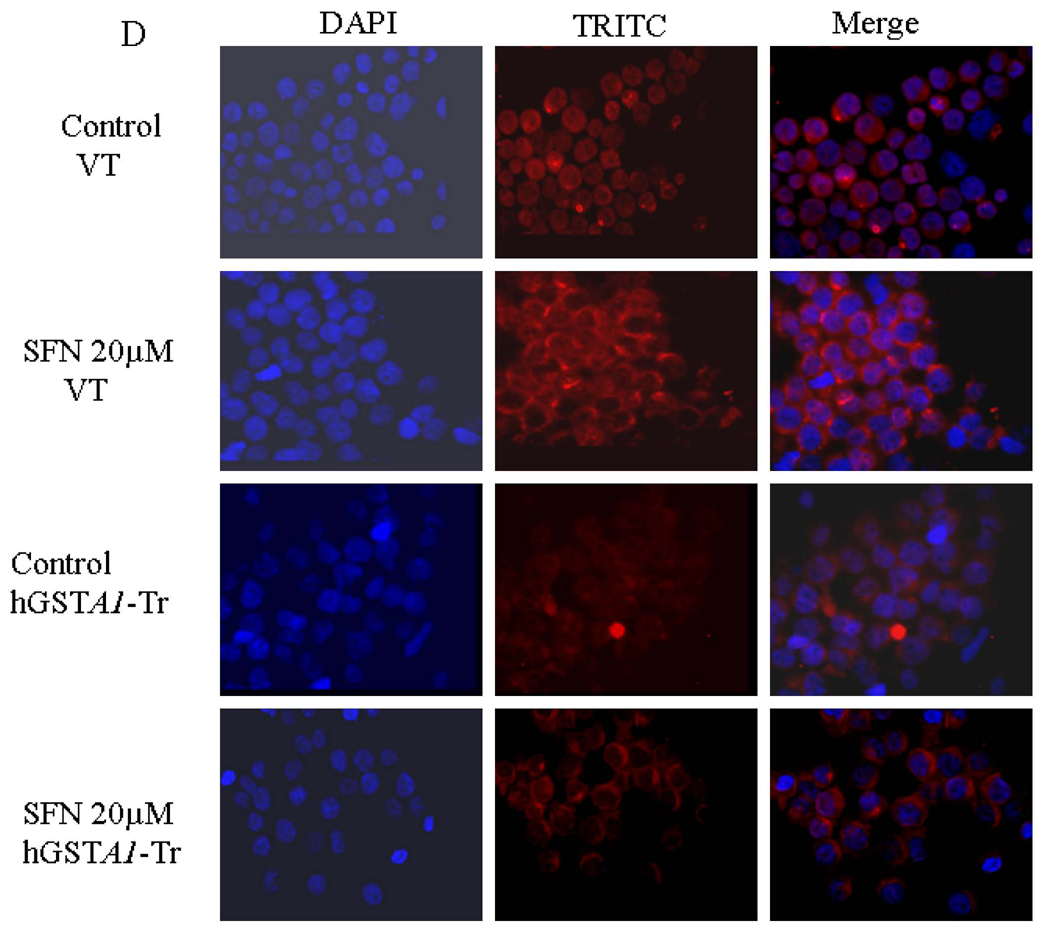
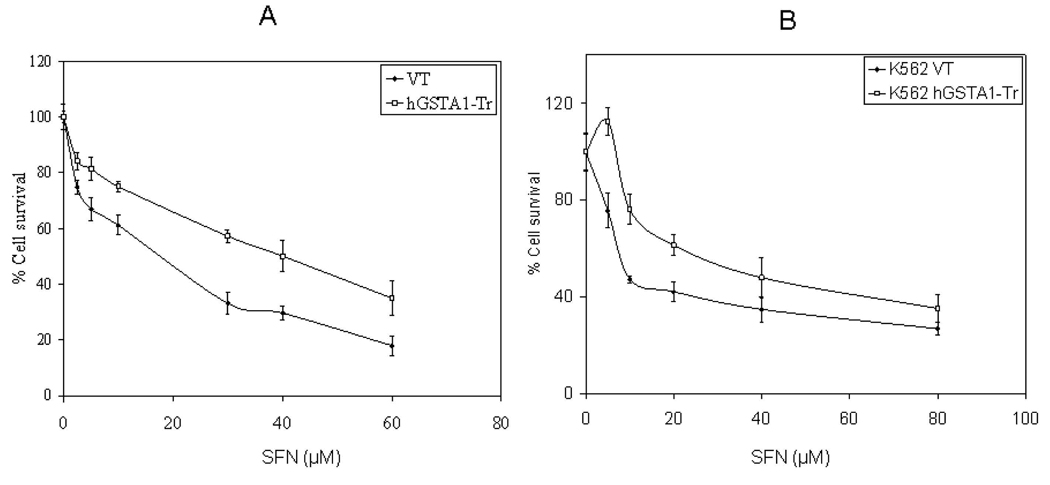
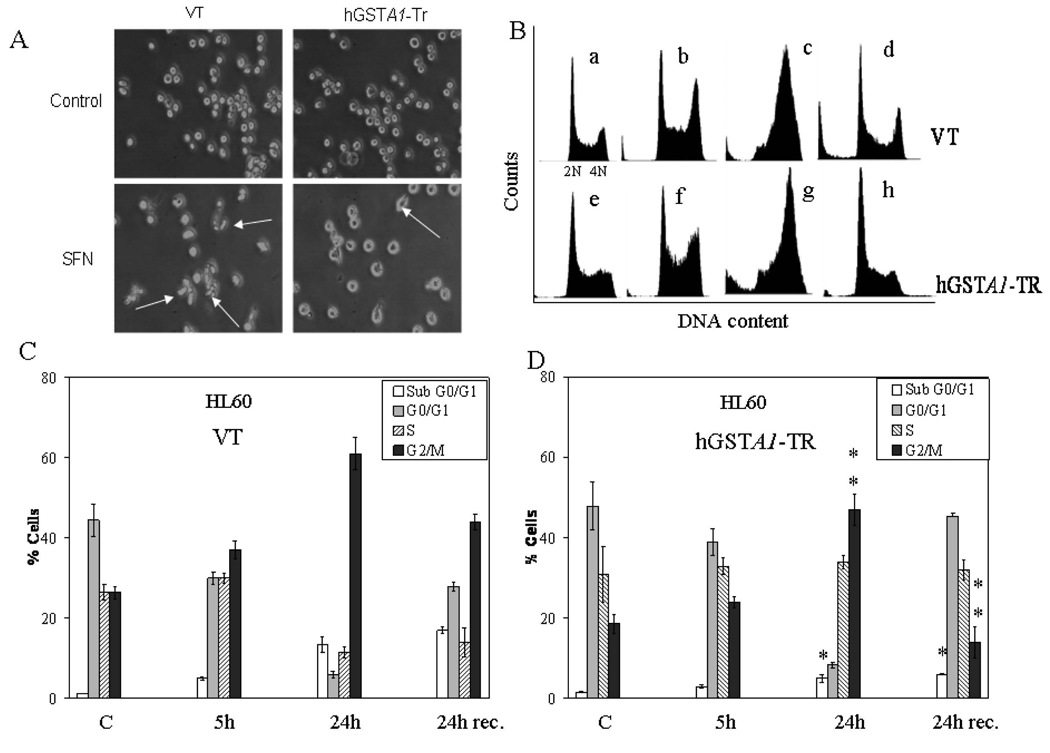
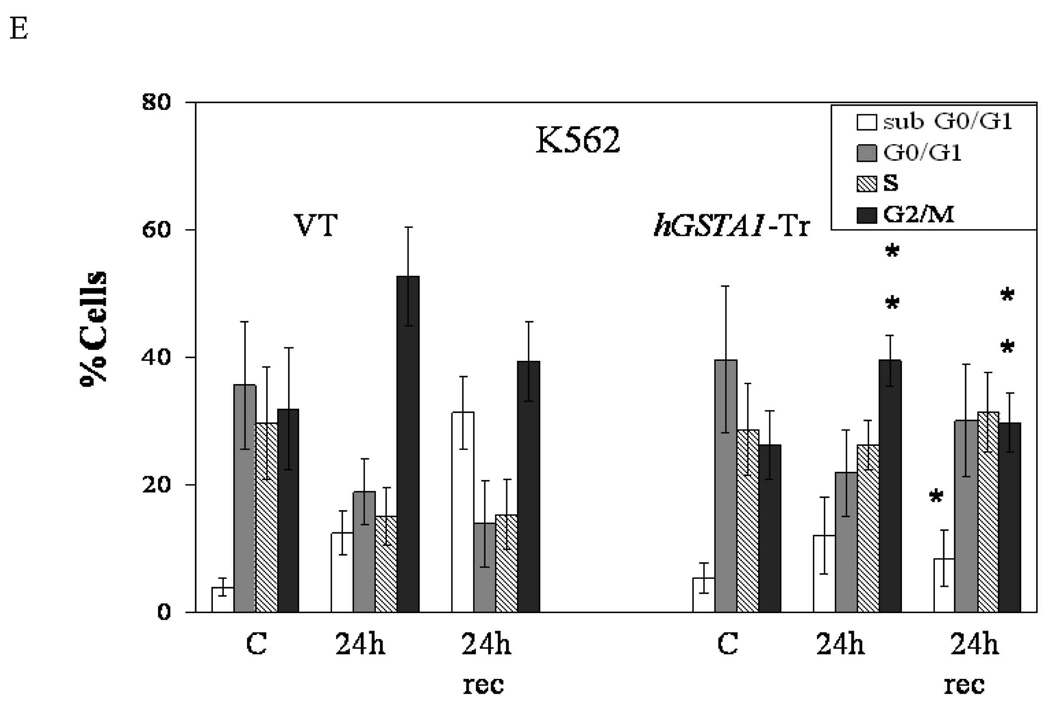
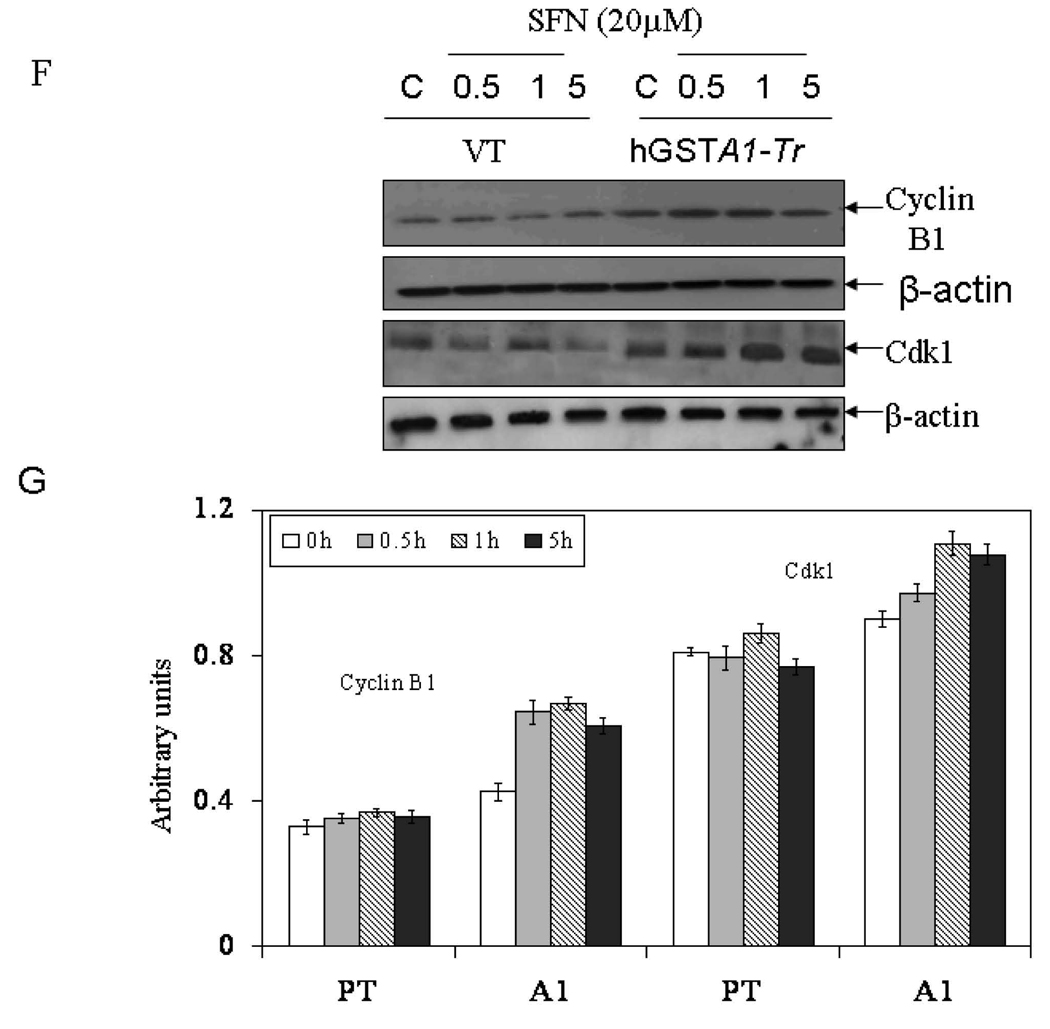
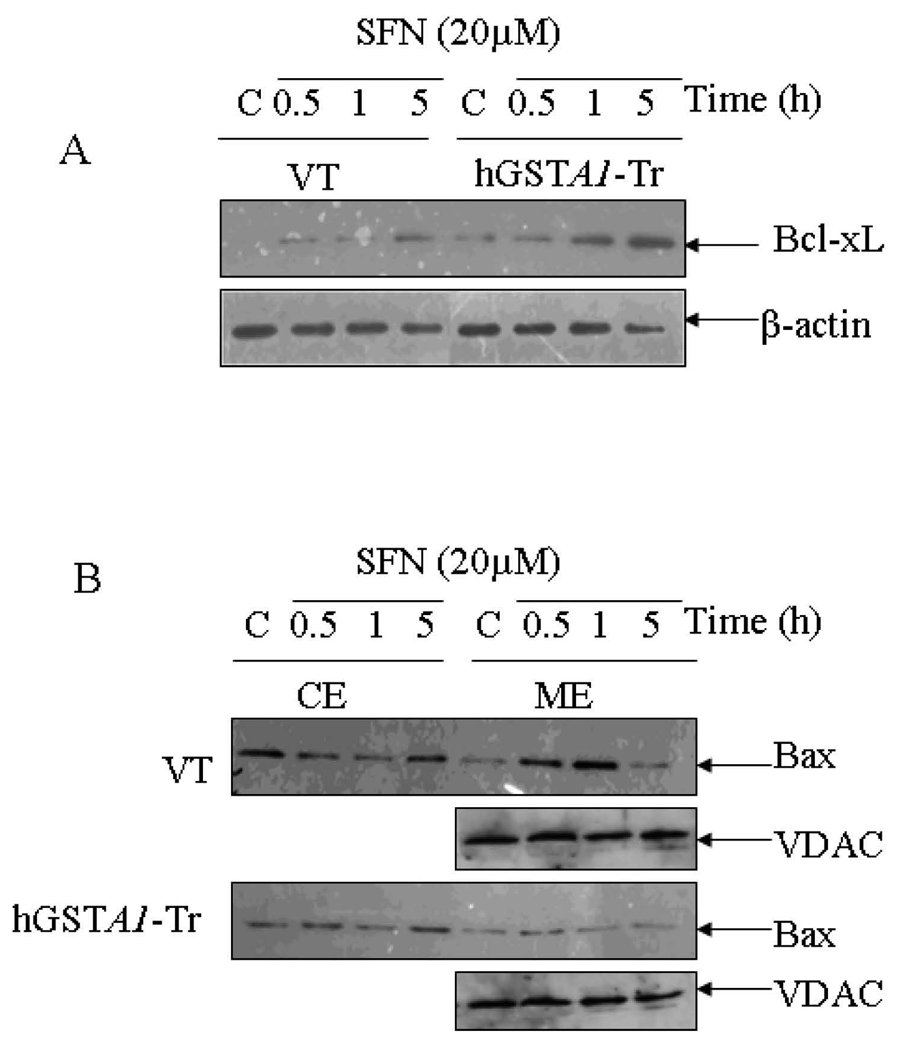
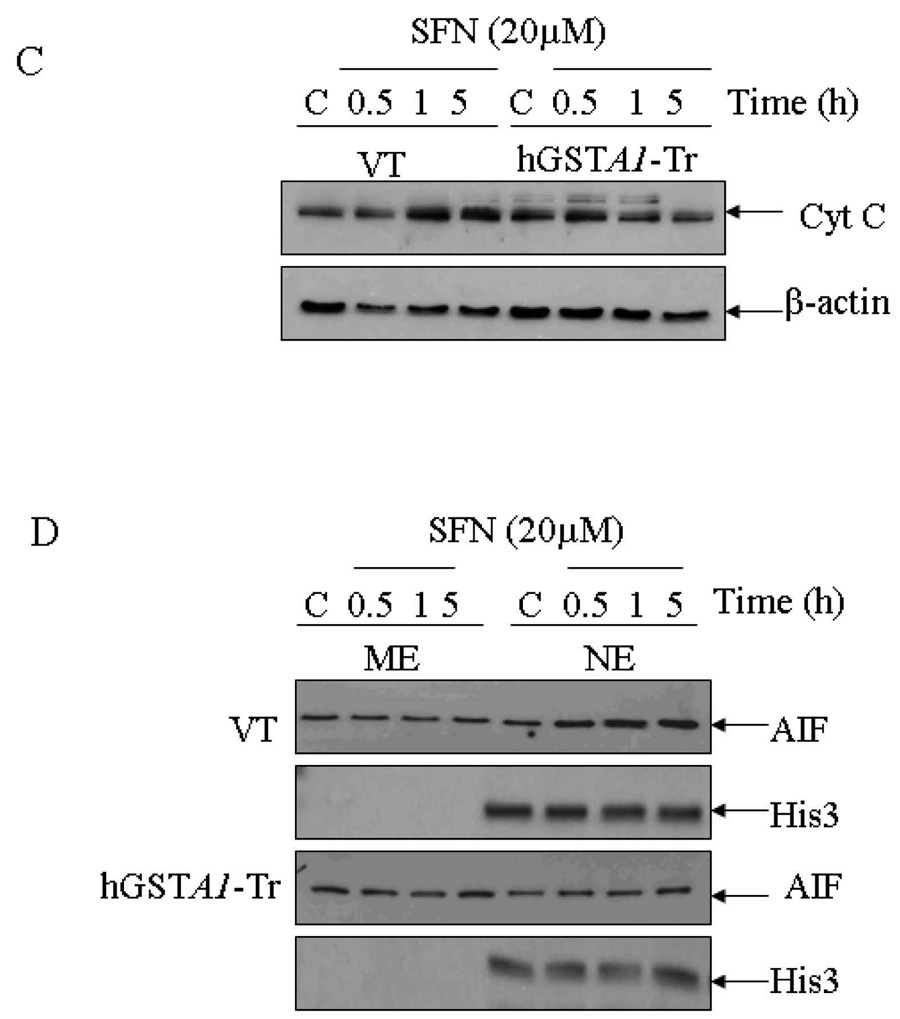
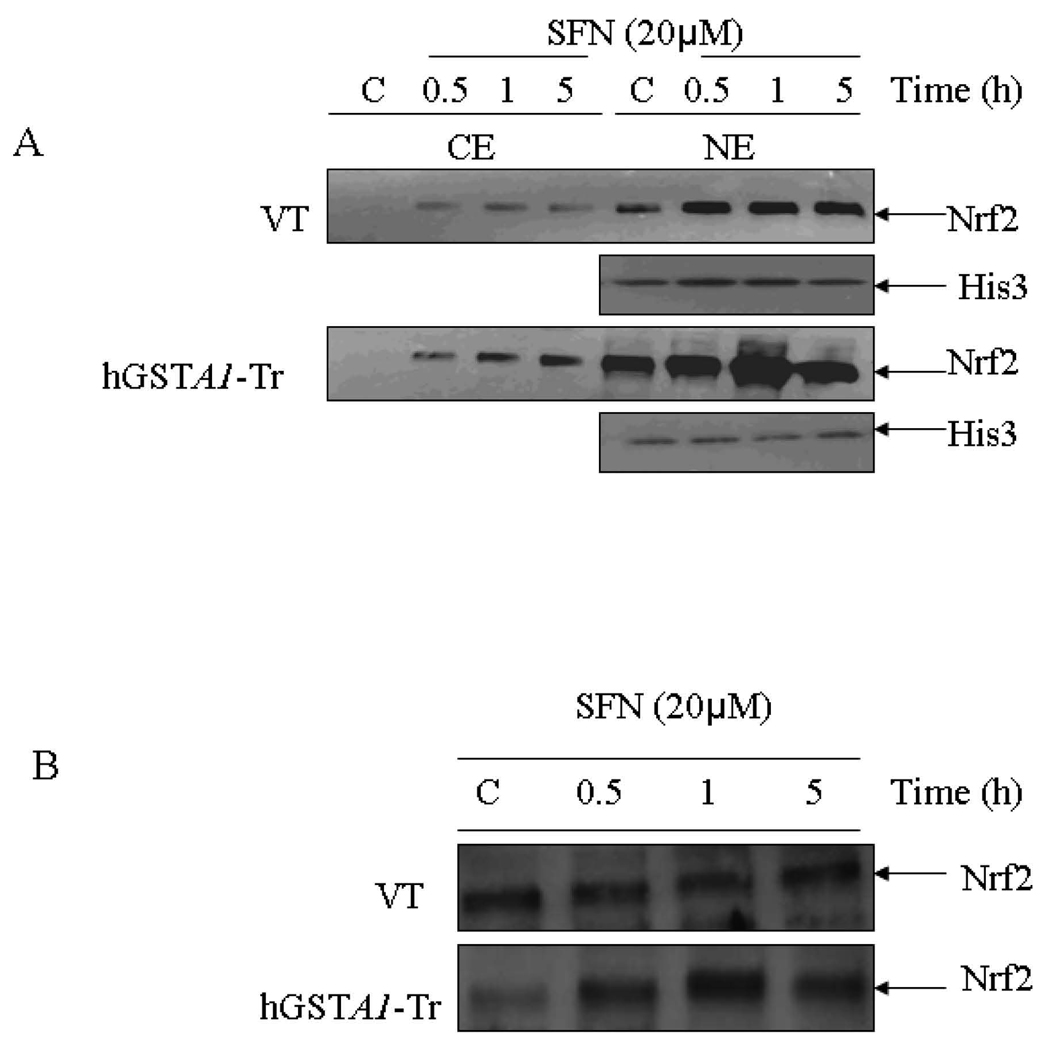
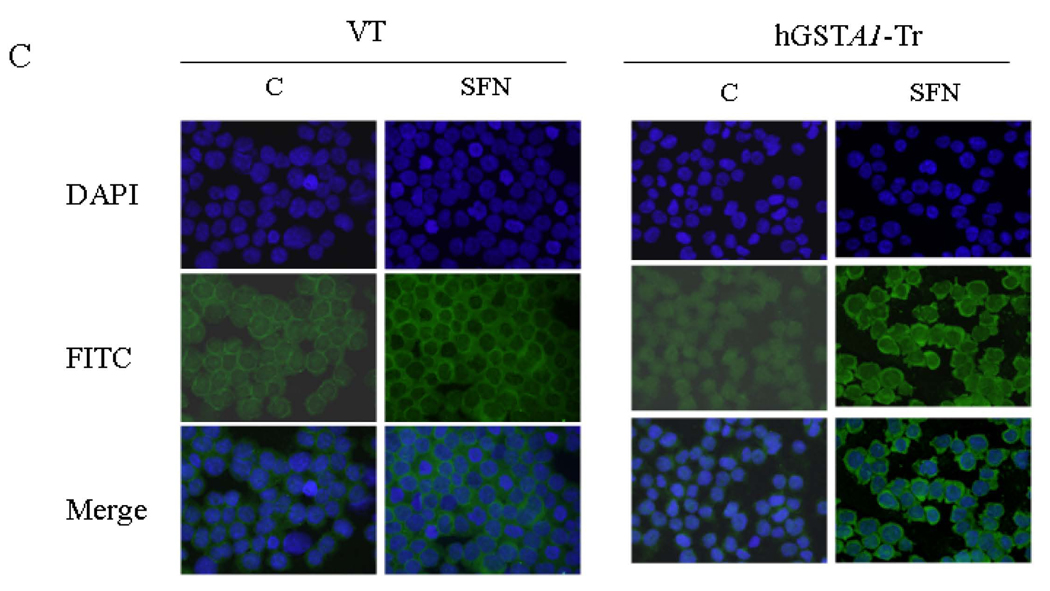
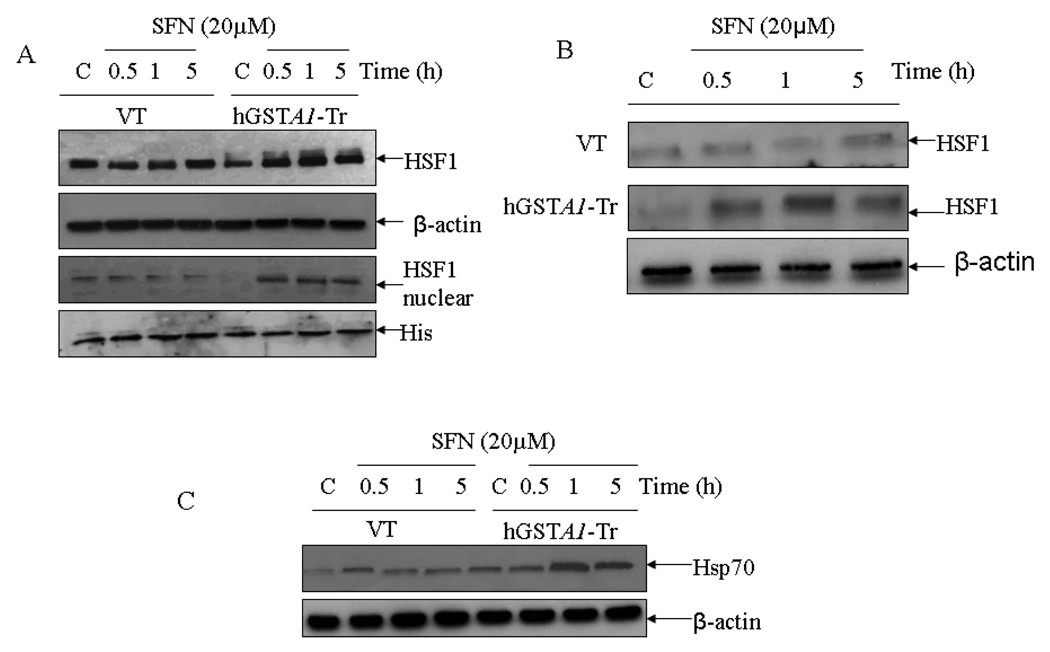
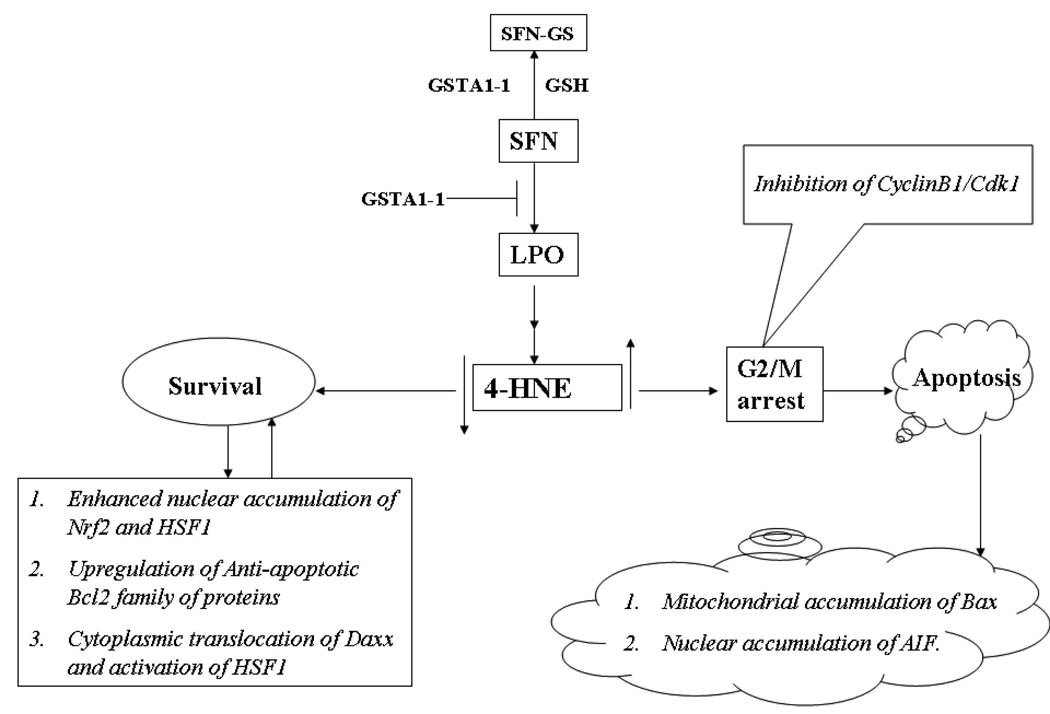
D,L-sulforaphane (SFN), a synthetic analogue of the broccoli-derived l-isomer, is a highly promising cancer chemopreventive agent substantiated by inhibition of chemically induced cancer in rodents and prevention of cancer development and distant site metastasis in transgenic mouse models of cancer. SFN is also known to inhibit growth of human cancer cells in association with cell cycle arrest and reactive oxygen species-dependent apoptosis, but the mechanism of these cellular responses to SFN exposure is not fully understood. Because 4-hydroxynonenal (4-HNE), a product of lipid peroxidation (LPO), the formation of which is regulated by hGSTA1-1, assumes a pivotal role in oxidative stress-induced signal transduction, we investigated its contribution in growth arrest and apoptosis induction by SFN using HL60 and K562 human leukemic cell lines as a model. The SFN-induced formation of 4-HNE was suppressed in hGSTA1-1-overexpressing cells, which also acquired resistance to SFN-induced cytotoxicity, cell cycle arrest, and apoptosis. While resistance to SFN-induced cell cycle arrest by ectopic expression of hGSTA1-1 was associated with changes in levels of G2/M regulatory proteins, resistance to apoptosis correlated with an increased Bcl-xL/Bax ratio, inhibition of nuclear translocation of AIF, and attenuated cytochrome c release in cytosol. The hGSTA1-1-overexpressing cells exhibited enhanced cytoplasmic export of Daxx, nuclear accumulation of transcription factors Nrf2 and HSF1, and upregulation of their respective client proteins, gamma-GCS and HSP70. These findings not only reveal a central role of 4-HNE in cellular responses to SFN but also reaffirm that 4-HNE contributes to oxidative stress-mediated signaling.


Figures

Fig. 1
Fig. 1. Expression of hGSTA1-1 in hGSTA1 transfected cells
HL60 (A) and K562 (B) cells were transfected with the cDNA of hGSTA1 cloned in the pTarget-T mammalian expression vector or the vector alone as described in the Methods section. The supernatant fraction (28,000g) of homogenates of the wild-type (WT), vector (VT) and hGSTA1-transfected (hGSTA1-Tr) HL60 cells containing 30µg of protein was subjected to SDS-PAGE in 12% gel. Expression of hGSTA1-1 in the stable-transfected clone selected in G418 (300µg/ml) was analyzed by Western blot analysis using polyclonal primary antibodies against human α-class GSTs raised in rabbits and peroxidase-conjugated goat anti-rabbit secondary antibodies. The blot was developed using chemiluminescence (Supersignal West Pico, Pierce) reagents. Lanes have been appropriately marked on the immunoblots. Representative immunoblot from one of the several hGSTA1-1expressing clones selected is shown. C. Levels of 4-HNE in SFN treated VT and hGSTA1-1 expressing HL60 and K562 cells: VT and hGSTA1-1 expressing cells (2×10⁷) were incubated with RPMI complete medium containing SFN (0–40µM) for 5h at 37°C. After pelleting them by centrifugation, cells were washed and sonicated (3× 10s, 30W) in PBS containing BHT (5mM final concentration) on ice. 4-HNE levels in the cell pellets were measured by using LPO-586 kit as per the manufacturer’s instructions. Data presented are Mean ± SD (n=3, * and ** represent a significant difference in 4-HNE levels of VT and hGSTA1-1 expressing HL60 and K562 cells respectively; p< 0.05). D. Immunofluorescence analysis of 4-HNE adducts in SFN treated VT and hGSTA1-1 expressing HL60 cells: VT and hGSTA1-1 expressing HL60 cells (1×10⁶) were treated with SFN (20µM) for 2h at 37°C in RPMI complete medium. After pelleting them by centrifugation at 1000rpm (5min), cells were washed and resuspended in PBS. Aliquots of cell suspensions were cytospun at 500rpm for 5 min onto the superfrost Fisher brand slides and fixed in 4% paraformaldehyde for 20min. The cells were incubated with the primary antibodies against 4-HNE-protein adduct (1:500) prepared in the blocking buffer (1% BSA +1% goat serum in PBS) overnight at 4°C in a humidified chamber. After three washings with PBS (5min each), cells were incubated with TRITC conjugated secondary antibodies (1:500) for 2h at room temperature. Subsequently, this was once again followed by three washings with PBS (10min each), mounted with Vecta Shield containing DAPI and observed under the Nikon Eclipse E800 fluorescence microscope with a 40x objective. Different panels of photographs with DAPI and TRITC stains have been appropriately marked in the figure.
Fig. 2
Fig. 2. Cytotoxic effects of SFN on VT and hGSTA1-1 expressing cells
VT and hGSTA1-1 expressing HL60 (A) and K562 (B) cells (2×10⁴) were plated into replicate wells of a 96 well plate in RPMI complete growth medium. After incubating the cells overnight, cells were treated with different concentrations of SFN (0–60µM) prepared in DMSO (final concentration; 0.02%) with appropriate controls and were incubated for 24h at 37 °C after which the MTT assay was performed as described in the Materials and Methods section. The OD580 values of samples subtracted from those of respective blanks (no cells) were normalized with control values. The values shown are Mean ± SD (n=3 done in quadruplets, p<0.01).
Fig. 3
Fig. 3. FACS analysis of the SFN-induced cell cycle arrest in VT and hGSTA1-1 over expressing cells
Cells (2×10⁵) plated in complete growth medium were treated with SFN (20µM) for 5h and 24h time points at 37°C with appropriate controls. Separate groups of cells were also allowed to recover for 24h after a 24h treatment of SFN. After the treatment, cells were pelleted, washed with PBS and fixed in an ice cold 70% ethanol. As described in the Methods section, cells were stained with propidium iodide (1mg/ml) and analysed using the Beckman Coulter Cytomics FC500, Flow Cytometry Analyzer. A. Morphology of cells undergoing SFN induced cell cycle arrest (shown by arrows) viewed under a phase contrast light microscope B. Flow cytometric histograms of the percentage of cells in different phases of cell cycle (a–d; (upper) VT and e–f; (lower) hGSTA1-transfected cells) Panel a &e: control; b&f: 5h SFN treatment c&g: 24h SFN treatment d&h: 24h recovered cells after 24h of SFN treatment. C and D, Bar charts showing the percentage of cells in the respective phases (sub G0/G1, G0/G1, S and G2/M) of the cell cycle (Mean ± SD) from three independent experiments. E. Bar chart showing the effect of SFN on the cell cycle of K562 (VT and hGSTA1 transfected) cells. F Western blot analysis of cell cycle related proteins Cdk1 and cyclin B1expression respectively in control and SFN treated VT and hGSTA1-1 expressing HL60 cells. G. Densitometric analysis of bands obtained for cyclin B1 and cdk1 on immunoblots.* and **represent significant differences in the percentages of cells in apoptosis (sub G0/G1) and G2/M Phase respectively in VT and hGSTA1-1.
Fig. 4
Fig. 4. Effects of SFN on the expression of apoptosis related proteins (Bcl-xL, Bax, AIF and cytochrome C) in VT and hGSTA1-1 expressing HL60 cells
Plated cells (5×10⁶) were incubated with SFN (20µM) in complete RPMI growth medium for different time points (0.5h, 1h and 5h) at 37°C. After treatment, they were pelleted by centrifugation and washed 2X with PBS. Whole cell extracts were prepared in RIPA lysis buffer while sub cellular (cytoplasmic, nuclear and mitochondrial) fractionation was performed as described in Materials and Methods and by the Imgenex Kit as per the manufacturer’s instructions. Western blot analyses of these extracts were carried out by using antibodies against Bcl-xL (panel A), Bax (panel B); cytochrome C (panel C) and AIF (panel D). Immunoblots were also probed with β-actin (total and cytoplasmic extracts to ascertain equal loading of proteins. The blot was developed using chemiluminescence (Supersignal West Pico, Pierce) reagents to detect the bands on immunoblots.
Fig. 5
Fig. 5. A. Effect of SFN on the expression and localization of Nrf2 in VT and hGSTA1-1 expressing cells
Cells were treated with SFN (20µM) for different time points (0.5, 1 and 5h). Cytoplasmic and nuclear extracts of control and treated cells were prepared and subjected to Western blot analyses as described in the legend of Fig. 4. A representative Western blot showing the expression of Nrf2 in cytoplasmic and nuclear protein fractions obtained from control and SFN treated VT and hGSTA1-1 expressing HL60 cells. B. Western blot of nuclear extract of VT and hGSTA1-1 expressing K562 cells. C. Immunofluorescence localization of Nrf2 in control and SFN treated VT and hGSTA1-1 expressing HL60 cells. Control and SFN treated cells (2×10⁵) for immunolocalization of Nrf2 were essentially processed as described in the legend for Fig. 2B except that antibodies used were those against Nrf2 (diluted 1:200 in blocking buffer) and FITC conjugated secondary antibodies.
Fig. 6
Fig. 6. Effect of SFN on the expression and localization of HSF1 (A and B), Hsp70 (C) and Daxx (D and E) in VT and hGSTA1-1 expressing cells
Cells (2×10⁶) were treated with SFN (20µM) in complete growth medium at 37°C for different time points as shown in the figure. Total cell extracts in RIPA buffer, cytoplasmic and nuclear fractions of the cells were prepared as described in the Method section. Western blot analyses of the SDS-PAGE resolved proteins (50–60µg protein in each lane) were carried out by using antibodies against Daxx, HSF1, and Hsp70 as described in the Methods section.
Fig. 7
Fig. 7. A theoretical model for the mechanisms by which SFN-induced generation and accumulation of 4-HNE affects signaling for cell cycle arrest and apoptosis and inhibition of these effects of SFN by GSTA1-1
The model illustrates that treatment of cells with SFN causes enhanced LPO-induced accumulation of 4-HNE which contributes to SFN-induced cell cycle arrest in G2/M phase through inhibition of cyclin B1 and cdk1, and apoptosis via down regulation of anti-apoptotic Bcl-xL, increased translocation of proapototic Bax to mitochondria, increased accumulation of AIF to nucleus and cytoplasmic release of cytochrome C. These SFN-induced effects are inhibited by the enforced expression of GSTA1-1 in cells. The over expression of GSTA1-1 limits the formation of 4-HNE by reducing upstream LPO products, which leads to the up regulation of Bcl-xL, facilitated cytoplasmic export of the transcription repressor Daxx accompanied by enhanced nuclear accumulation of the transcription factors Nrf2 and HSF1, and activation of the associated stress responsive antioxidant and heat shock proteins.

References

    1. Juge N, Mithen RF, Traka M. Molecular basis for chemoprevention by sulforaphane: a comprehensive review. Cell Mol. Life Sci. 2007;64:1105–1127. - PMC - PubMed
    1. Payrastre GL, Li P, Lumeau S, Cassar G, Dupont MA, Chevolleau S, Gasc N, Tulliez J, Tercé F. Sulforaphane, a naturally occurring isothiocyanate, induces cell cycle arrest and apoptosis in HT29 human colon cancer cells. Cancer Res. 2000;60:1426–1433. - PubMed
    1. Singh SV, Herman-Antosiewicz A, Singh AV, Lew KL, Srivastava SK, Kamath R, Brown KD, Zhang L, Baskaran R. Sulforaphane-induced G2/M phase cell cycle arrest involves checkpoint kinase 2-mediated phosphorylation of cell division cycle 25C. J Biol Chem. 2004;279:25813–25822. - PubMed
    1. Singh SV, Srivastava SK, Choi S, Lew KL, Antosiewicz J, Xiao D, Zeng Y, Watkins SC, Johnson CS, Trump DL, Lee YJ, Xiao H, Herman-Antosiewicz A. Sulforaphane-induced cell death in human prostate cancer cells is initiated by reactive oxygen species. J. Biol. Chem. 2005;280:19911–19924. - PubMed
    1. Xiao D, Srivastava SK, Lew KL, Zeng Y, Hershberger P, Johnson CS, Trump DL, Singh SV. Allyl isothiocyanate, a constituent of cruciferous vegetables, inhibits proliferation of human prostate cancer cells by causing G2/M arrest and inducing apoptosis. Carcinogenesis. 2003;24:891–897. - PubMed

Publication types

MeSH terms

Substances