

Two-color STED microscopy reveals different degrees of colocalization between hexokinase-I and the three human VDAC isoforms
- PMID: 20205711
- PMCID: PMC2838807
- DOI: 10.1186/1757-5036-3-4
Two-color STED microscopy reveals different degrees of colocalization between hexokinase-I and the three human VDAC isoforms
Abstract
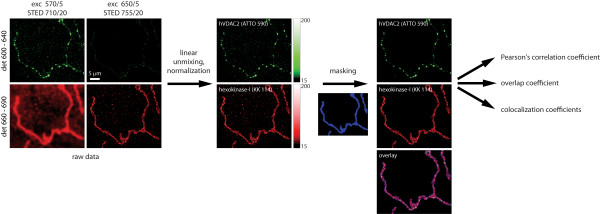
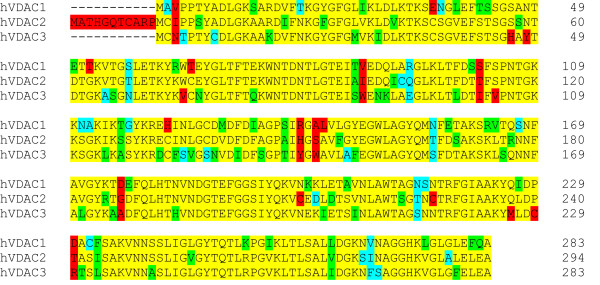
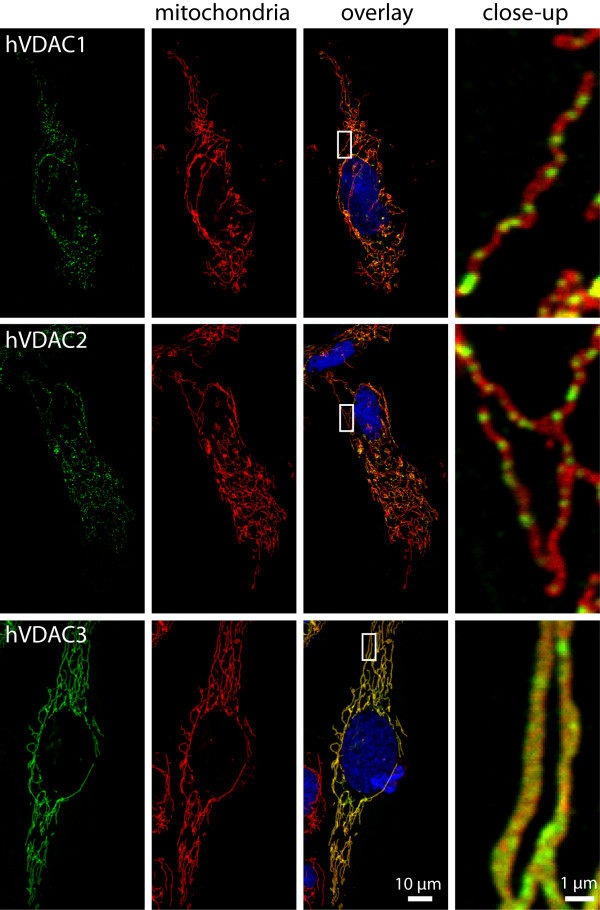
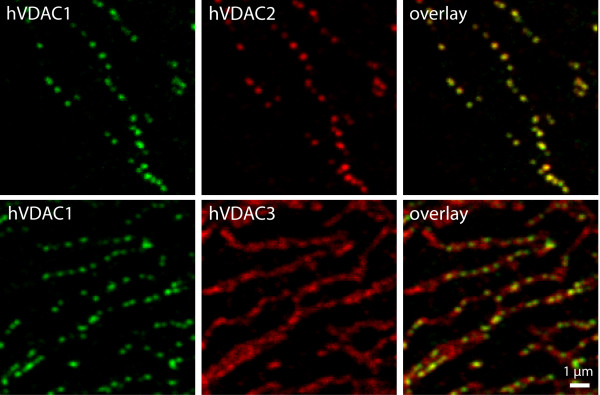
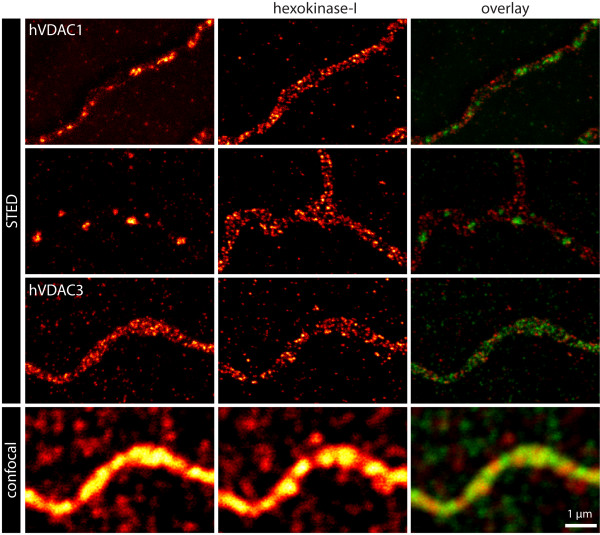
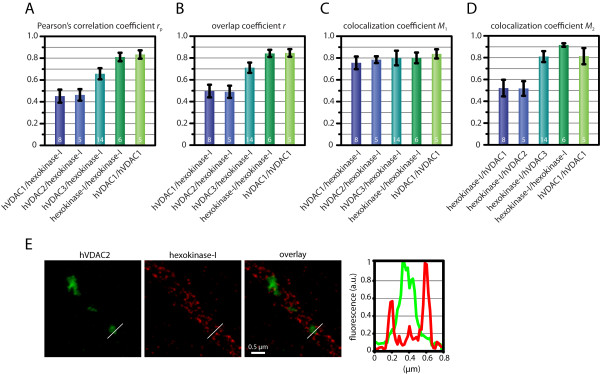
The voltage-dependent anion channel (VDAC, also known as mitochondrial porin) is the major transport channel mediating the transport of metabolites, including ATP, across the mitochondrial outer membrane. Biochemical data demonstrate the binding of the cytosolic protein hexokinase-I to VDAC, facilitating the direct access of hexokinase-I to the transported ATP. In human cells, three hVDAC isoforms have been identified. However, little is known on the distribution of these isoforms within the outer membrane of mitochondria and to what extent they colocalize with hexokinase-I. In this study we show that whereas hVDAC1 and hVDAC2 are localized predominantly within the same distinct domains in the outer membrane, hVDAC3 is mostly uniformly distributed over the surface of the mitochondrion. We used two-color stimulated emission depletion (STED) microscopy enabling a lateral resolution of ~40 nm to determine the detailed sub-mitochondrial distribution of the three hVDAC isoforms and hexokinase-I. Individual hVDAC and hexokinase-I clusters could thus be resolved which were concealed in the confocal images. Quantitative colocalization analysis of two-color STED images demonstrates that within the attained resolution, hexokinase-I and hVDAC3 exhibit a higher degree of colocalization than hexokinase-I with either hVDAC1 or hVDAC2. Furthermore, a substantial fraction of the mitochondria-bound hexokinase-I pool does not colocalize with any of the three hVDAC isoforms, suggesting a more complex interplay of these proteins than previously anticipated. This study demonstrates that two-color STED microscopy in conjunction with quantitative colocalization analysis is a powerful tool to study the complex distribution of membrane proteins in organelles such as mitochondria.PACS: 87.16.Tb, 87.85.Rs.
Figures
Similar articles
-
Cloning and functional expression in yeast of two human isoforms of the outer mitochondrial membrane channel, the voltage-dependent anion channel.J Biol Chem. 1993 Jan 25;268(3):1835-41. J Biol Chem. 1993. PMID: 8420959
-
Subcellular localization of human voltage-dependent anion channel isoforms.J Biol Chem. 1995 Jun 9;270(23):13998-4006. doi: 10.1074/jbc.270.23.13998. J Biol Chem. 1995. PMID: 7539795
-
Charged residues distribution modulates selectivity of the open state of human isoforms of the voltage dependent anion-selective channel.PLoS One. 2014 Aug 1;9(8):e103879. doi: 10.1371/journal.pone.0103879. eCollection 2014. PLoS One. 2014. PMID: 25084457 Free PMC article.
-
Is there VDAC in cell compartments other than the mitochondria?J Bioenerg Biomembr. 1996 Apr;28(2):93-100. doi: 10.1007/BF02110638. J Bioenerg Biomembr. 1996. PMID: 9132422 Review.
-
Hexokinase-binding properties of the mitochondrial VDAC protein: inhibition by DCCD and location of putative DCCD-binding sites.J Bioenerg Biomembr. 1989 Aug;21(4):461-70. doi: 10.1007/BF00762518. J Bioenerg Biomembr. 1989. PMID: 2478532 Review.
Cited by
-
Hypothermia-Induced Ubiquitination of Voltage-Dependent Anion Channel 3 Protects BV2 Microglia Cells From Cytotoxicity Following Oxygen-Glucose Deprivation/Recovery.Front Mol Neurosci. 2020 Jun 5;13:100. doi: 10.3389/fnmol.2020.00100. eCollection 2020. Front Mol Neurosci. 2020. PMID: 32581711 Free PMC article.
-
Anion Channels of Mitochondria.Handb Exp Pharmacol. 2017;240:71-101. doi: 10.1007/164_2016_39. Handb Exp Pharmacol. 2017. PMID: 27783269 Free PMC article. Review.
-
Regulation of Cell Death by Mitochondrial Transport Systems of Calcium and Bcl-2 Proteins.Membranes (Basel). 2020 Oct 21;10(10):299. doi: 10.3390/membranes10100299. Membranes (Basel). 2020. PMID: 33096926 Free PMC article. Review.
-
Insights Into the Role of Mitochondrial Ion Channels in Inflammatory Response.Front Physiol. 2020 Apr 9;11:258. doi: 10.3389/fphys.2020.00258. eCollection 2020. Front Physiol. 2020. PMID: 32327997 Free PMC article. Review.
-
Nanoscale distribution of mitochondrial import receptor Tom20 is adjusted to cellular conditions and exhibits an inner-cellular gradient.Proc Natl Acad Sci U S A. 2011 Aug 16;108(33):13546-51. doi: 10.1073/pnas.1107553108. Epub 2011 Jul 28. Proc Natl Acad Sci U S A. 2011. PMID: 21799113 Free PMC article.
References
LinkOut - more resources
Full Text Sources
Other Literature Sources
Molecular Biology Databases
