. 2010 Feb 3:8:4.
doi: 10.1186/1477-5956-8-4.

Plasma proteome analysis of patients with type 1 diabetes with diabetic nephropathy

Affiliations

Plasma proteome analysis of patients with type 1 diabetes with diabetic nephropathy

Anne Julie Overgaard et al. Proteome Sci. .

Abstract

Background: As part of a clinical proteomics program focused on diabetes and its complications we are looking for new and better protein biomarkers for diabetic nephropathy. The search for new and better biomarkers for diabetic nephropathy has, with a few exceptions, previously focused on either hypothesis-driven studies or urinary based investigations. To date only two studies have investigated the proteome of blood in search for new biomarkers, and these studies were conducted in sera from patients with type 2 diabetes. This is the first reported in depth proteomic study where plasma from type 1 diabetic patients was investigated with the goal of finding improved candidate biomarkers to predict diabetic nephropathy. In order to reach lower concentration proteins in plasma a pre-fractionation step, either hexapeptide bead-based libraries or anion exchange chromatography, was performed prior to surface enhanced laser desorption/ionization time-of-flight mass spectrometry analysis.

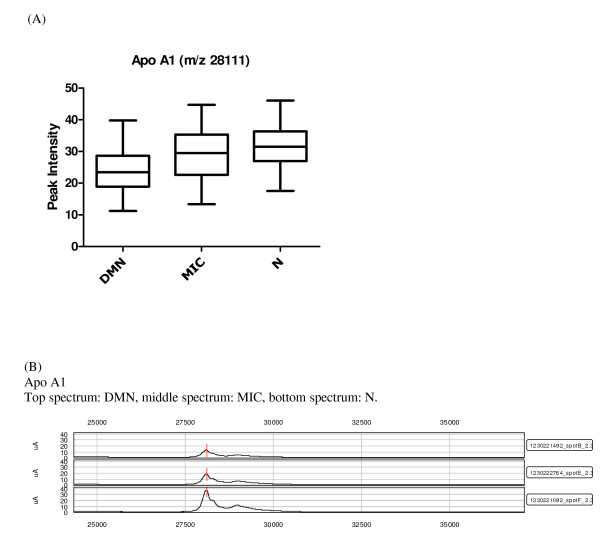
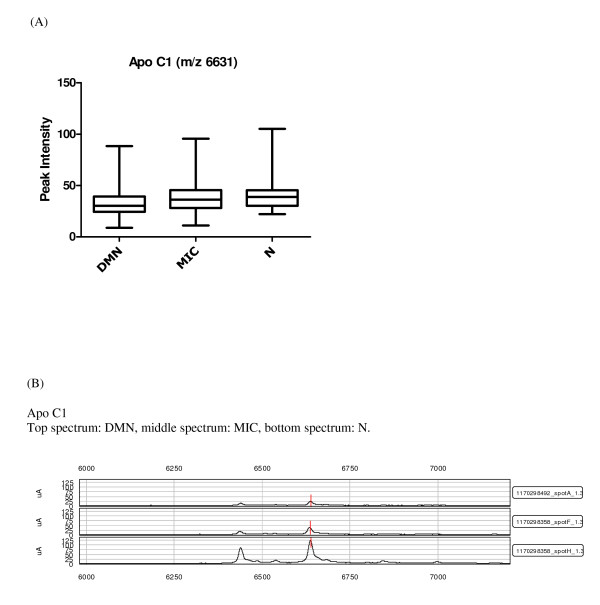
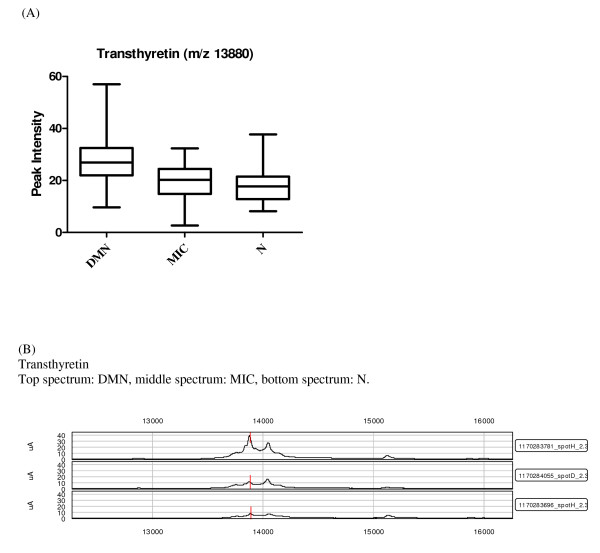
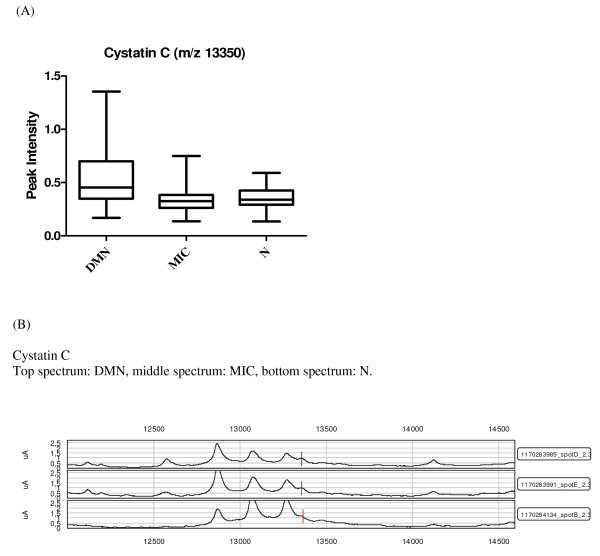
Results: Proteomic analysis of plasma from a cross-sectional cohort of 123 type 1 diabetic patients previously diagnosed as normoalbuminuric, microalbuminuric or macroalbuminuric, gave rise to 290 peaks clusters of which 16 were selected as the most promising biomarker candidates based on statistical performance, including independent component analysis. Four of the peaks that were discovered have been identified as transthyretin, apolipoprotein A1, apolipoprotein C1 and cystatin C. Several yet unidentified proteins discovered by this novel approach appear to have more potential as biomarkers for diabetic nephropathy.

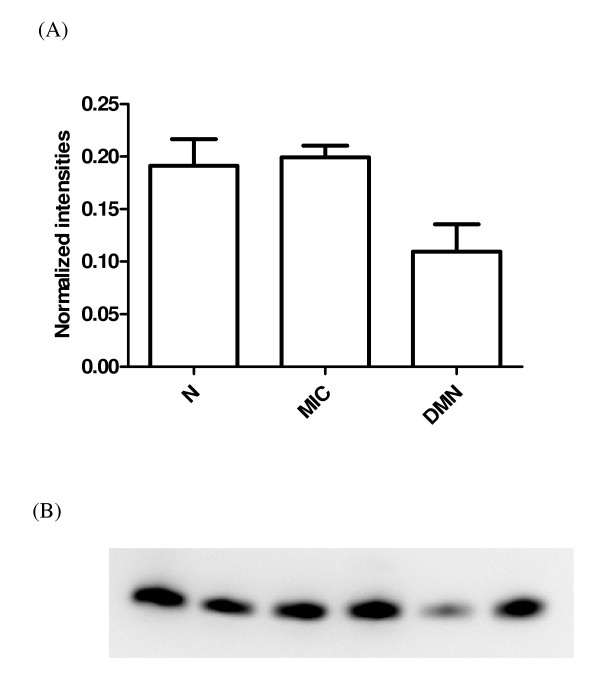
Conclusion: These results demonstrate the capacity of proteomic analysis of plasma, by confirming the presence of known biomarkers as well as revealing new biomarkers for diabetic nephropathy in plasma in type 1 diabetic patients.


Figures

Figure 1
Figure 1
Candidate biomarkers for diabetic nephropathy. (A) Box and whiskers plot of apo A1 intensity, where the three diabetic groups are divided by albuminuria, the ordinate represents the peak intensity for the marker. (B) SELDI-TOF-MS spectra of known markers of diabetic nephropathy significantly different between the groups: apo A1, the ordinate is the m/z of the peak, and the abscissa is the relative intensity.
Figure 2
Figure 2
Candidate biomarkers for diabetic nephropathy. (A) Box and whiskers plot of apo C1 intensity, where the three diabetic groups are divided by albuminuria, the ordinate represents the peak intensity for the marker. (B) SELDI-TOF-MS spectra of known markers of diabetic nephropathy significantly different between the groups: apo C1, the ordinate is the m/z of the peak, and the abscissa is the relative intensity.
Figure 3
Figure 3
Western blots of apo C1. (A) The chart represents the normalized average intensities (SD) of two independent gels of the same six samples, two from each group of diabetic patients. The bands intensities where detected by the computer software Multi Gauge version 2.0 from Fujifilm. (B) On the gel the first two lanes, from left to right, is two samples from the N group, next two lanes are two samples from the MIC group, and the last two are from the DMN group.
Figure 4
Figure 4
Candidate biomarkers for diabetic nephropathy. (A) Box and whiskers plot of transthyretin intensity, where the three diabetic groups are divided by albuminuria, the ordinate represents the peak intensity for the marker. (B) SELDI-TOF-MS spectra of known markers of diabetic nephropathy significantly different between the groups: transthyretin, the ordinate is the m/z of the peak, and the abscissa is the relative intensity.
Figure 5
Figure 5
Candidate biomarkers for diabetic nephropathy. (A) Box and whiskers plot of cystatin C intensity, where the three diabetic groups are divided by albuminuria, the ordinate represents the peak intensity for the marker. (B) SELDI-TOF-MS spectra of known markers of diabetic nephropathy significantly different between the groups: cystatin C, the ordinate is the m/z of the peak, and the abscissa is the relative intensity.

Similar articles

Cited by

References

    1. Caramori ML, Fioretto P, Mauer M. Enhancing the Predictive Value of Urinary Albumin for Diabetic Nephropathy. J Am Soc Nephrol. 2006;17:339–352. doi: 10.1681/ASN.2005101075. - DOI - PubMed
    1. Hovind P, Tarnow L, Rossing K, Rossing P, Eising S, Larsen N, Binder C, Parving H-H. Decreasing Incidence of Severe Diabetic Microangiopathy in Type 1 Diabetes. Diabets Care. 2003;26:1258–1264. doi: 10.2337/diacare.26.4.1258. - DOI - PubMed
    1. Finne P, Reunanen A, Stenman S, Groop P-H, Gronhagen-Riska C. Incidence of End-stage Renal Disease in Patients With Type 1 Diabetes. JAMA. 2005;294:1782–1787. doi: 10.1001/jama.294.14.1782. - DOI - PubMed
    1. Daneman D. Type 1 diabetes. The Lancet. 2006;367:847–858. doi: 10.1016/S0140-6736(06)68341-4. - DOI - PubMed
    1. Cameron JS. The discovery of diabetic nephropathy: from small print to centre stage. J Nephrol. 2006. pp. 75–87. - PubMed