

Cerebrospinal fluid pulse pressure amplitude during lumbar infusion in idiopathic normal pressure hydrocephalus can predict response to shunting
- PMID: 20205911
- PMCID: PMC2829499
- DOI: 10.1186/1743-8454-7-5
Cerebrospinal fluid pulse pressure amplitude during lumbar infusion in idiopathic normal pressure hydrocephalus can predict response to shunting
Abstract
Background: We have previously seen that idiopathic normal pressure hydrocephalus (iNPH) patients having elevated intracranial pressure (ICP) pulse amplitude consistently respond to shunt surgery. In this study we explored how the cerebrospinal fluid pressure (CSFP) pulse amplitude determined during lumbar infusion testing, correlates with ICP pulse amplitude determined during over-night ICP monitoring and with response to shunt surgery. Our goal was to establish a more reliable screening procedure for selecting iNPH patients for shunt surgery using lumbar intrathecal infusion.
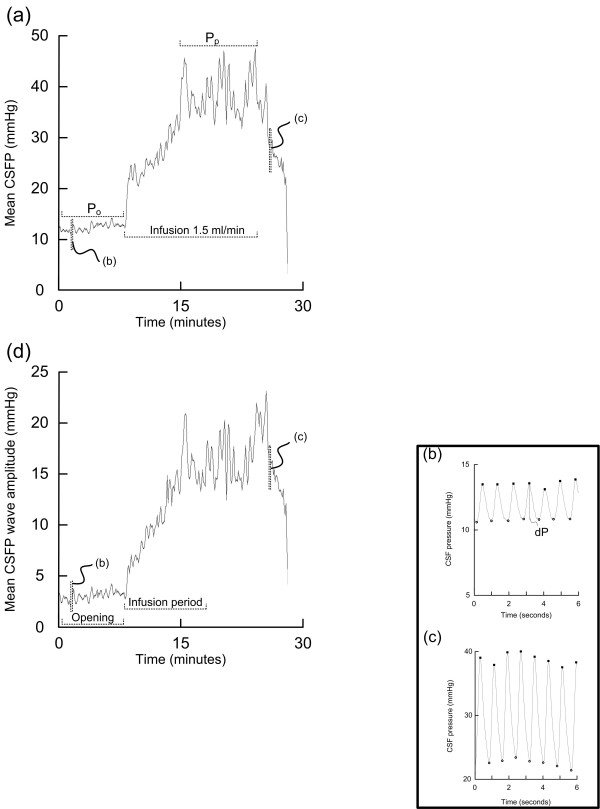
Methods: The study population consisted of all iNPH patients undergoing both diagnostic lumbar infusion testing and continuous over-night ICP monitoring during the period 2002-2007. The severity of iNPH was assessed using our NPH grading scale before surgery and 12 months after shunting. The CSFP pulse was characterized from the amplitude of single pressure waves.
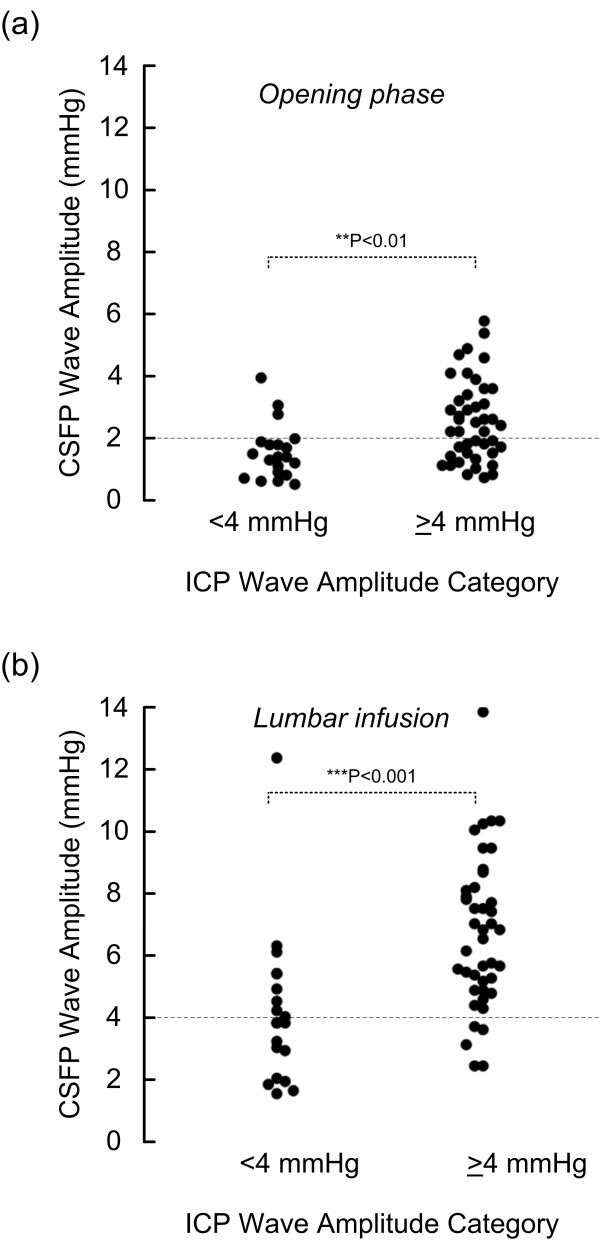
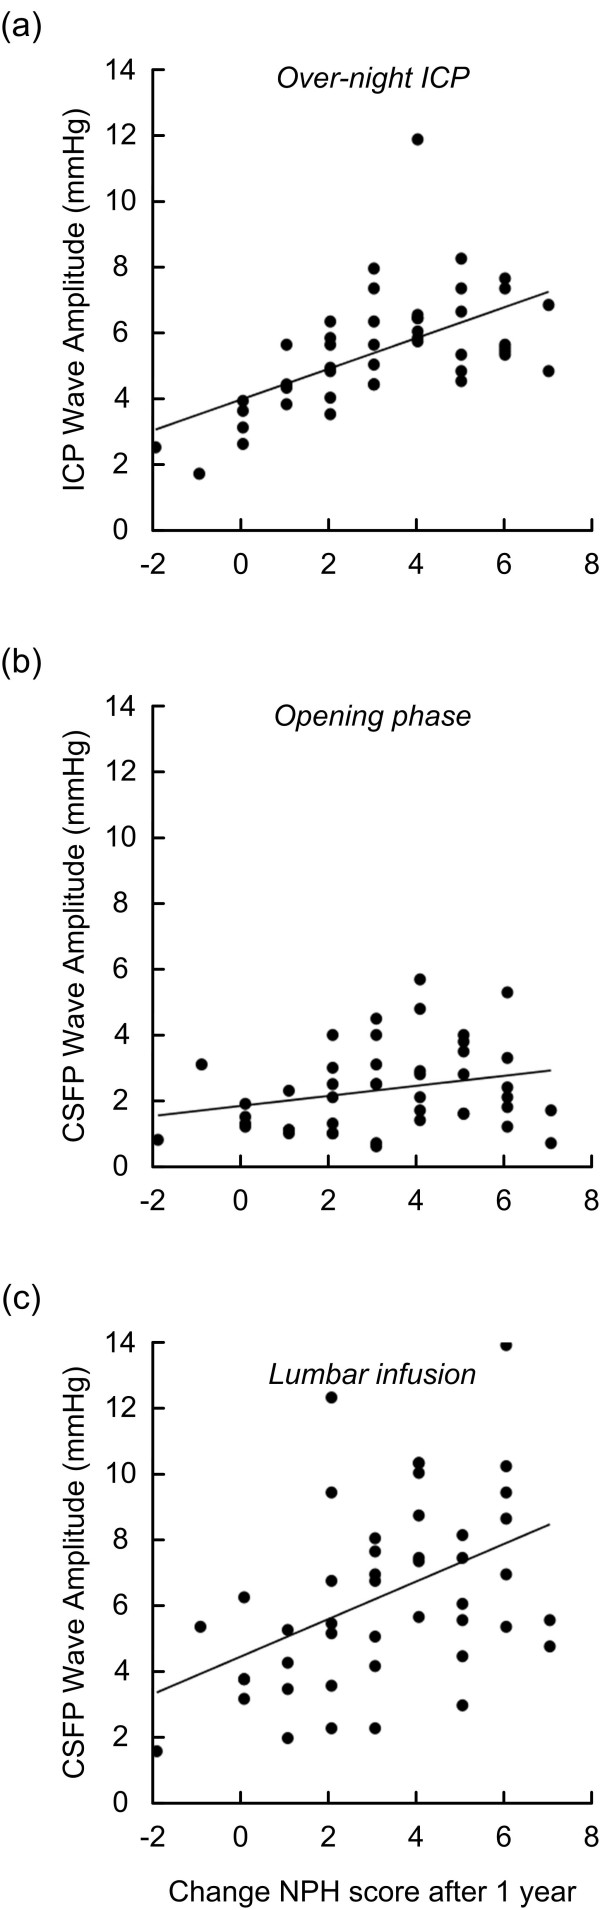
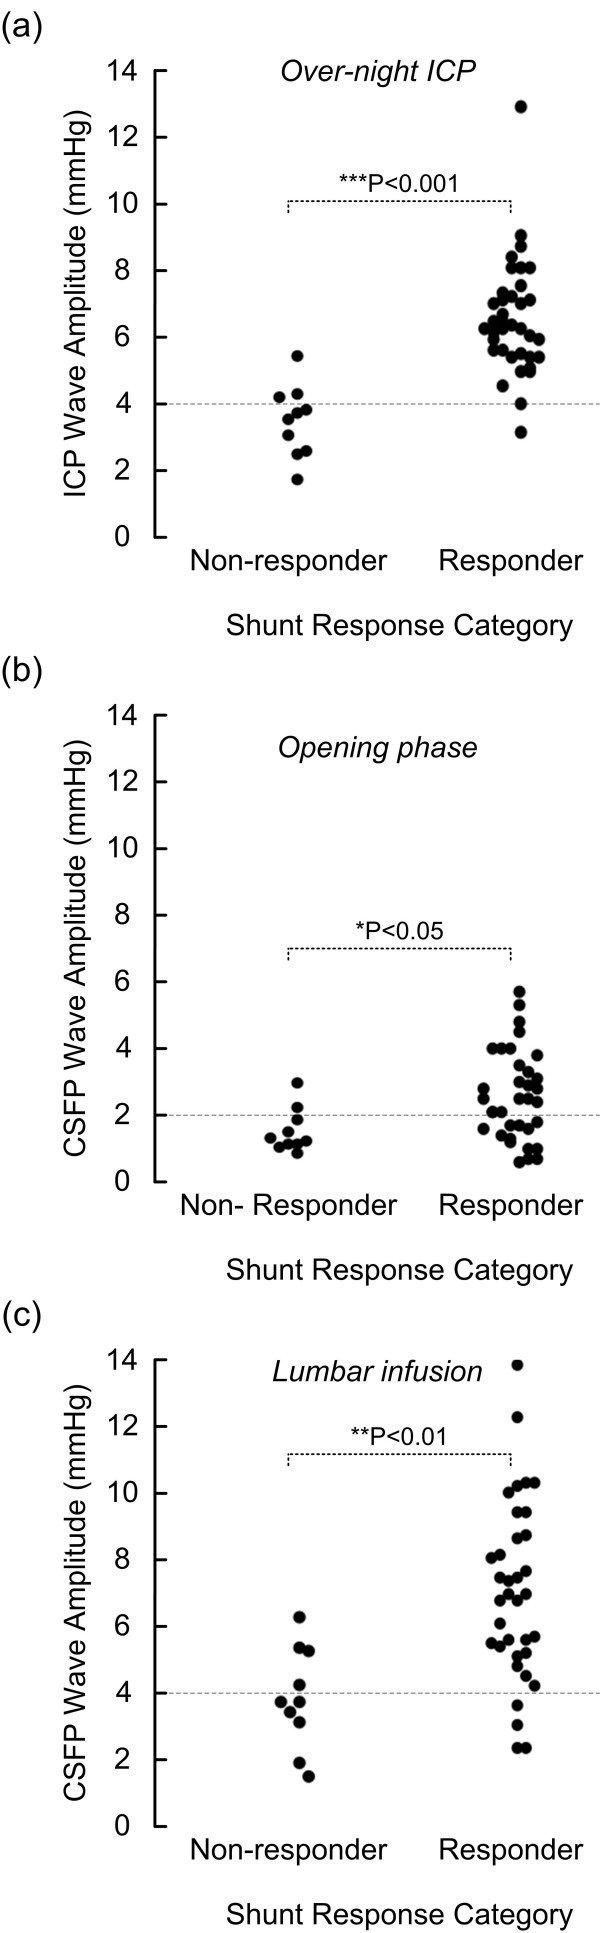
Results: Totally 62 iNPH patients were included, 45 of them underwent shunt surgery, in whom 78% were shunt responders. Among the 45 shunted patients, resistance to CSF outflow (R(out)) was elevated (>or= 12 mmHg/ml/min) in 44. The ICP pulse amplitude recorded over-night was elevated (i.e. mean ICP wave amplitude >or= 4 mmHg) in 68% of patients; 92% of these were shunt responders. In those with elevated overnight ICP pulse amplitude, we found also elevated CSFP pulse amplitude recorded during lumbar infusion testing, both during the opening phase following lumbar puncture and during a standardized period of lumbar infusion (15 ml Ringer over 10 min). The clinical response to shunting after 1 year strongly associated with the over-night ICP pulse amplitude, and also with the pulsatile CSFP during the period of lumbar infusion. Elevated CSFP pulse amplitude during lumbar infusion thus predicted shunt response with sensitivity of 88 and specificity of 60 (positive and negative predictive values of 89 and 60, respectively).
Conclusions: In iNPH patients, shunt response can be anticipated in 9/10 patients with elevated overnight ICP pulse amplitude, while in only 1/10 with low ICP pulse amplitude. Additionally, the CSFP pulse amplitude during lumbar infusion testing was elevated in patients with elevated over-night ICP pulse amplitude. In particular, measurement of CSFP pulse amplitude during a standardized infusion of 15 ml Ringer over 10 min was useful in predicting response to shunt surgery and can be used as a screening procedure for selection of iNPH patients for shunting.
Figures
Similar articles
-
Diagnosis and Treatment of Idiopathic Normal Pressure Hydrocephalus.Continuum (Minneap Minn). 2016 Apr;22(2 Dementia):579-99. doi: 10.1212/CON.0000000000000305. Continuum (Minneap Minn). 2016. PMID: 27042909 Free PMC article. Review.
-
Lumbar cerebrospinal fluid pressure waves versus intracranial pressure waves in idiopathic normal pressure hydrocephalus.Br J Neurosurg. 2006 Dec;20(6):407-14. doi: 10.1080/02688690601047312. Br J Neurosurg. 2006. PMID: 17439094
-
The Prediction of Shunt Response in Idiopathic Normal-Pressure Hydrocephalus Based on Intracranial Pressure Monitoring and Lumbar Infusion.Acta Neurochir Suppl. 2016;122:267-74. doi: 10.1007/978-3-319-22533-3_53. Acta Neurochir Suppl. 2016. PMID: 27165919
-
Idiopathic normal pressure hydrocephalus: diagnostic and predictive value of clinical testing, lumbar drainage, and CSF dynamics.J Neurosurg. 2016 Sep;125(3):591-7. doi: 10.3171/2015.8.JNS151112. Epub 2016 Jan 29. J Neurosurg. 2016. PMID: 26824377
-
Diagnostic intracranial pressure monitoring and surgical management in idiopathic normal pressure hydrocephalus: a 6-year review of 214 patients.Neurosurgery. 2010 Jan;66(1):80-91. doi: 10.1227/01.NEU.0000363408.69856.B8. Neurosurgery. 2010. PMID: 20023540 Review.
Cited by
-
Diagnosis and Treatment of Idiopathic Normal Pressure Hydrocephalus.Continuum (Minneap Minn). 2016 Apr;22(2 Dementia):579-99. doi: 10.1212/CON.0000000000000305. Continuum (Minneap Minn). 2016. PMID: 27042909 Free PMC article. Review.
-
A comparison between the pathophysiology of multiple sclerosis and normal pressure hydrocephalus: is pulse wave encephalopathy a component of MS?Fluids Barriers CNS. 2016 Sep 22;13(1):18. doi: 10.1186/s12987-016-0041-2. Fluids Barriers CNS. 2016. PMID: 27658732 Free PMC article.
-
The correlations between a proposed pathogenesis of syringomyelia and normal pressure hydrocephalus.Neurosurg Rev. 2010 Oct;33(4):505-6. doi: 10.1007/s10143-010-0281-6. Epub 2010 Aug 17. Neurosurg Rev. 2010. PMID: 20714911 No abstract available.
-
Choroid plexus-targeted NKCC1 overexpression to treat post-hemorrhagic hydrocephalus.Neuron. 2023 May 17;111(10):1591-1608.e4. doi: 10.1016/j.neuron.2023.02.020. Epub 2023 Mar 8. Neuron. 2023. PMID: 36893755 Free PMC article.
-
Comment: Invasive tests for predicting shunt response in idiopathic normal pressure hydrocephalus-the risk aspect.Acta Neurochir (Wien). 2022 Feb;164(2):479-480. doi: 10.1007/s00701-021-05049-x. Epub 2021 Nov 6. Acta Neurochir (Wien). 2022. PMID: 34743225 No abstract available.
References
-
- Adams RD, Fisher CM, Hakim S, Ojemann RG, Sweet WH. Symptomatic occult hydrocephalus with "normal" cerebrospinal fluid pressure: A treatable syndrome. N Engl J Med. 1965;273:117–126. - PubMed
LinkOut - more resources
Full Text Sources
