

Spatial clustering in the spatio-temporal dynamics of endemic cholera
- PMID: 20205935
- PMCID: PMC2846945
- DOI: 10.1186/1471-2334-10-51
Spatial clustering in the spatio-temporal dynamics of endemic cholera
Abstract
Background: The spatio-temporal patterns of infectious diseases that are environmentally driven reflect the combined effects of transmission dynamics and environmental heterogeneity. They contain important information on different routes of transmission, including the role of environmental reservoirs. Consideration of the spatial component in infectious disease dynamics has led to insights on the propagation of fronts at the level of counties in rabies in the US, and the metapopulation behavior at the level of cities in childhood diseases such as measles in the UK, both at relatively coarse scales. As epidemiological data on individual infections become available, spatio-temporal patterns can be examined at higher resolutions.
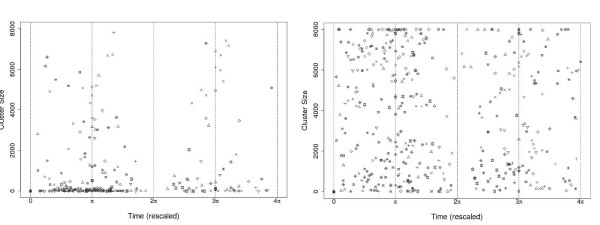
Methods: The extensive spatio-temporal data set for cholera in Matlab, Bangladesh, maps the individual location of cases from 1983 to 2003. This unique record allows us to examine the spatial structure of cholera outbreaks, to address the role of primary transmission, occurring from an aquatic reservoir to the human host, and that of secondary transmission, involving a feedback between current and past levels of infection. We use Ripley's K and L indices and bootstrapping methods to evaluate the occurrence of spatial clustering in the cases during outbreaks using different temporal windows. The spatial location of cases was also confronted against the spatial location of water sources.
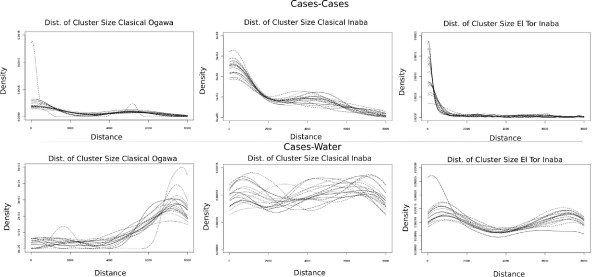
Results: Spatial clustering of cholera cases was detected at different temporal and spatial scales. Cases relative to water sources also exhibit spatial clustering.
Conclusions: The clustering of cases supports an important role of secondary transmission in the dynamics of cholera epidemics in Matlab, Bangladesh. The spatial clustering of cases relative to water sources, and its timing, suggests an effective role of water reservoirs during the onset of cholera outbreaks. Once primary transmission has initiated an outbreak, secondary transmission takes over and plays a fundamental role in shaping the epidemics in this endemic area.
Figures


Similar articles
-
Spatio-temporal clustering of cholera: the impact of flood control in Matlab, Bangladesh, 1983-2003.Health Place. 2009 Sep;15(3):741-52. doi: 10.1016/j.healthplace.2008.12.008. Epub 2009 Jan 10. Health Place. 2009. PMID: 19217821 Free PMC article.
-
Micro-scale Spatial Clustering of Cholera Risk Factors in Urban Bangladesh.PLoS Negl Trop Dis. 2016 Feb 11;10(2):e0004400. doi: 10.1371/journal.pntd.0004400. eCollection 2016 Feb. PLoS Negl Trop Dis. 2016. PMID: 26866926 Free PMC article.
-
Spatial and population drivers of persistent cholera transmission in rural Bangladesh: Implications for vaccine and intervention targeting.Spat Spatiotemporal Epidemiol. 2018 Feb;24:1-9. doi: 10.1016/j.sste.2017.09.001. Epub 2017 Oct 16. Spat Spatiotemporal Epidemiol. 2018. PMID: 29413709 Free PMC article.
-
The impact of climate on the disease dynamics of cholera.Clin Microbiol Infect. 2009 Jan;15 Suppl 1:29-31. doi: 10.1111/j.1469-0691.2008.02686.x. Clin Microbiol Infect. 2009. PMID: 19220350 Review.
-
Modeling Key Drivers of Cholera Transmission Dynamics Provides New Perspectives for Parasitology.Trends Parasitol. 2017 Aug;33(8):587-599. doi: 10.1016/j.pt.2017.04.002. Epub 2017 May 5. Trends Parasitol. 2017. PMID: 28483382 Review.
Cited by
-
A Systematic Bayesian Integration of Epidemiological and Genetic Data.PLoS Comput Biol. 2015 Nov 23;11(11):e1004633. doi: 10.1371/journal.pcbi.1004633. eCollection 2015 Nov. PLoS Comput Biol. 2015. PMID: 26599399 Free PMC article.
-
Elevation and cholera: an epidemiological spatial analysis of the cholera epidemic in Harare, Zimbabwe, 2008-2009.BMC Public Health. 2012 Jun 18;12:442. doi: 10.1186/1471-2458-12-442. BMC Public Health. 2012. PMID: 22708576 Free PMC article.
-
Multiscale model for forecasting Sabin 2 vaccine virus household and community transmission.PLoS Comput Biol. 2021 Dec 21;17(12):e1009690. doi: 10.1371/journal.pcbi.1009690. eCollection 2021 Dec. PLoS Comput Biol. 2021. PMID: 34932560 Free PMC article.
-
Social and spatial processes associated with childhood diarrheal disease in Matlab, Bangladesh.Health Place. 2013 Jan;19:45-52. doi: 10.1016/j.healthplace.2012.10.002. Epub 2012 Oct 22. Health Place. 2013. PMID: 23178328 Free PMC article.
-
The simultaneous effects of spatial and social networks on cholera transmission.Interdiscip Perspect Infect Dis. 2011;2011:604372. doi: 10.1155/2011/604372. Epub 2011 Dec 7. Interdiscip Perspect Infect Dis. 2011. PMID: 22187553 Free PMC article.
References
Publication types
MeSH terms
Grants and funding
LinkOut - more resources
Full Text Sources
Medical
Research Materials
Miscellaneous
