. 2010 Mar 12;86(3):331-42.
doi: 10.1016/j.ajhg.2010.01.026. Epub 2010 Mar 4.

Using principal components of genetic variation for robust and powerful detection of gene-gene interactions in case-control and case-only studies

Affiliations

Using principal components of genetic variation for robust and powerful detection of gene-gene interactions in case-control and case-only studies

Samsiddhi Bhattacharjee et al. Am J Hum Genet. .

Abstract

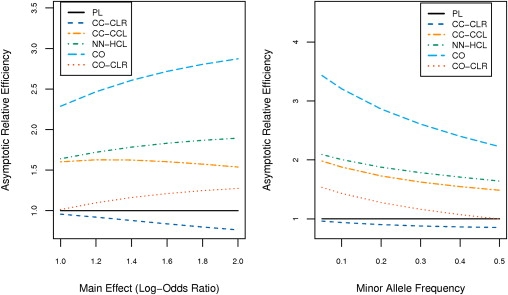
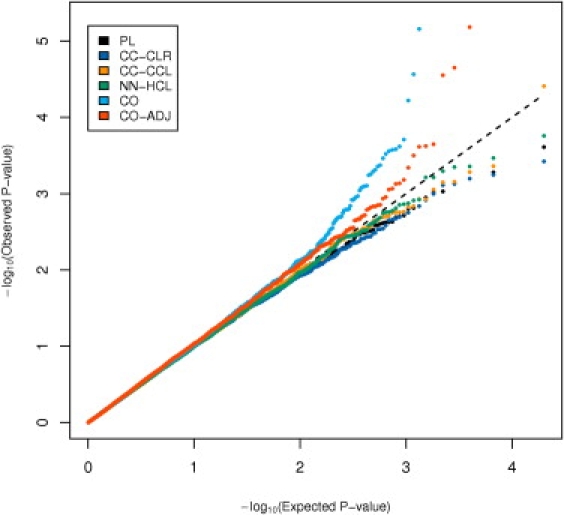
Many popular methods for exploring gene-gene interactions, including the case-only approach, rely on the key assumption that physically distant loci are in linkage equilibrium in the underlying population. These methods utilize the presence of correlation between unlinked loci in a disease-enriched sample as evidence of interactions among the loci in the etiology of the disease. We use data from the CGEMS case-control genome-wide association study of breast cancer to demonstrate empirically that the case-only and related methods have the potential to create large-scale false positives because of the presence of population stratification (PS) that creates long-range linkage disequilibrium in the genome. We show that the bias can be removed by considering parametric and nonparametric methods that assume gene-gene independence between unlinked loci, not in the entire population, but only conditional on population substructure that can be uncovered based on the principal components of a suitably large panel of PS markers. Applications in the CGEMS study as well as simulated data show that the proposed methods are robust to the presence of population stratification and are yet much more powerful, relative to standard logistic regression methods that are also commonly used as robust alternatives to the case-only type methods.


Figures

Figure 1
Figure 1
Genome-wide Scan for Interactions in CGEMS Breast Cancer Data q-q plots of (− log10 transformed) p values for tests of gene-gene interaction between rs2322659 in LCT gene (chr 2) and 472786 SNPs from remaining 21 autosomes. The five different methods implemented are PL (black line), the standard prospective logistic regression method (adjusted for significant PCs); CO (light blue line), the standard case-only method; CO-ADJ (red line), proposed adjusted case-only method; CC-CLR (dark blue line), standard conditional logistic regression with case-control matching; CC-CCL (orange line), proposed constrained conditional logistic method with case-control matching; and NN-HCL (green line), proposed hybrid conditional logistic method with nearest-neighbor matching. Genomic control inflation factor (IF) is shown for each analysis.
Figure 2
Figure 2
Principal Components in CGEMS Breast Cancer Data Pairwise scatter plots of the first four principal axes of genetic variation (labeled PC1, PC2, PC3, and PC4) in the CGEMS breast cancer data.
Figure 3
Figure 3
Asymptotic Relative Efficiency of Alternative Methods in the Absence of Population Stratification All AREs are evaluated in reference to standard prospective logistic regression (PL). The AREs are shown for PL (black line), CO (light blue line), CC-CLR (dark blue line), CC-CCL (orange line), NN-HCL (green line), and CO-CLR (red line). Left panel plots ARE as a function of the common main effect (β1 = β2 = β) of the two causal SNPs (fixing the common MAF at 0.3). Right panel plots ARE as a function of the common MAF (fixing the common main effect odds ratio at 1.4).
Figure 4
Figure 4
q-q Plot for Interactions among Simulated Null SNPs q-q plot of interaction p values for 10,000 pairs of simulated null SNPs where 96% of the pairs have constant allele frequencies across strata and 1% of the pairs have SNP frequencies covarying along each of the four possible axes of variation. The disease risk also varies along the first axis. See Figure 1 legend for details about the methods compared.
Figure 5
Figure 5
Simulation-Based Estimate of Power Simulation-based estimates of power for detecting interaction between a pair of susceptibility SNPs with 500 cases and 500 controls at a significance level of 0.01. Three scenarios are considered depending on how the allele frequencies of the causal SNPs and the disease risk vary along the underlying strata. The same panel of 12K PS markers are used for both simulation and data analysis. See Figure 1 legend for details about the methods compared.

References

    1. Moore J.H., Williams S.M. Epistasis and its implications for personal genetics. Am. J. Hum. Genet. 2009;85:309–320. - PMC - PubMed
    1. Piegorsch W.W., Weinberg C.R., Taylor J.A. Non-hierarchical logistic models and case-only designs for assessing susceptibility in population-based case-control studies. Stat. Med. 1994;13:153–162. - PubMed
    1. Khoury M.J., Flanders W.D. Nontraditional epidemiologic approaches in the analysis of gene-environment interaction: Case-control studies with no controls! Am. J. Epidemiol. 1996;144:207–213. - PubMed
    1. Zhao J., Jin L., Xiong M. Test for interaction between two unlinked loci. Am. J. Hum. Genet. 2006;79:831–845. - PMC - PubMed
    1. Zhang Y., Liu J.S. Bayesian inference of epistatic interactions in case-control studies. Nat. Genet. 2007;39:1167–1173. - PubMed

Publication types

LinkOut - more resources