In vivo 1D and 2D correlation MR spectroscopy of the soleus muscle at 7T
- PMID: 20206561
- PMCID: PMC3741347
- DOI: 10.1016/j.jmr.2010.02.008
In vivo 1D and 2D correlation MR spectroscopy of the soleus muscle at 7T
Abstract
Aim: This study aims to (1) undertake and analyse 1D and 2D MR correlation spectroscopy from human soleus muscle in vivo at 7T, and (2) determine T1 and T2 relaxation time constants at 7T field strength due to their importance in sequence design and spectral quantitation.
Method: Six healthy, male volunteers were consented and scanned on a 7T whole-body scanner (Siemens AG, Erlangen, Germany). Experiments were undertaken using a 28cm diameter detunable birdcage coil for signal excitation and an 8.5cm diameter surface coil for signal reception. The relaxation time constants, T1 and T2 were recorded using a STEAM sequence, using the 'progressive saturation' method for the T1 and multiple echo times for T2. The 2D L-Correlated SpectroscopY (L-COSY) method was employed with 64 increments (0.4ms increment size) and eight averages per scan, with a total time of 17min.
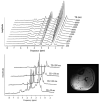
Results: T1 and T2 values for the metabolites of interest were determined. The L-COSY spectra obtained from the soleus muscle provided information on lipid content and chemical structure not available, in vivo, at lower field strengths. All molecular fragments within multiple lipid compartments were chemically shifted by 0.20-0.26ppm at this field strength. 1D and 2D L-COSY spectra were assigned and proton connectivities were confirmed with the 2D method.
Conclusion: In vivo 1D and 2D spectroscopic examination of muscle can be successfully recorded at 7T and is now available to assess lipid alterations as well as other metabolites present with disease. T1 and T2 values were also determined in soleus muscle of male healthy volunteers.
Copyright 2010 Elsevier Inc. All rights reserved.
Figures


References
-
- Goldman M, Porneuf M, editors. NMR and More in Honour of Anatole Abragam. Vol. 112. Les Ulis Cedex A; France: 1994. F-91944.
-
- Jeener J. Ampere International Summer School. Basko Polje; Yugoslavia: 1971.
-
- Cross KJ, Holmes KT, Mountford CE, Wright PE. Assignment of acyl chain resonances from membranes of mammalian cells by two-dimensional NMR methods. Biochemistry. 1984;23:5895–5897. - PubMed
-
- Williams PG, Saunders JK, Dyne M, Mountford CE, Holmes KT. Application of a T2-filtered COSY experiment to identify the origin of slowly relaxing species in normal and malignant tissue. Magn. Reson. Med. 1988;7:463–471. - PubMed
-
- Mountford CE, Doran S, Lean CL, Russell P. Proton MRS can determine the pathology of human cancers with a high level of accuracy. Chem. Rev. 2004;104:3677–3704. - PubMed
Publication types
MeSH terms
Substances
Grants and funding
LinkOut - more resources
Full Text Sources
Other Literature Sources

