

An alignment confidence score capturing robustness to guide tree uncertainty
- PMID: 20207713
- PMCID: PMC2908709
- DOI: 10.1093/molbev/msq066
An alignment confidence score capturing robustness to guide tree uncertainty
Abstract
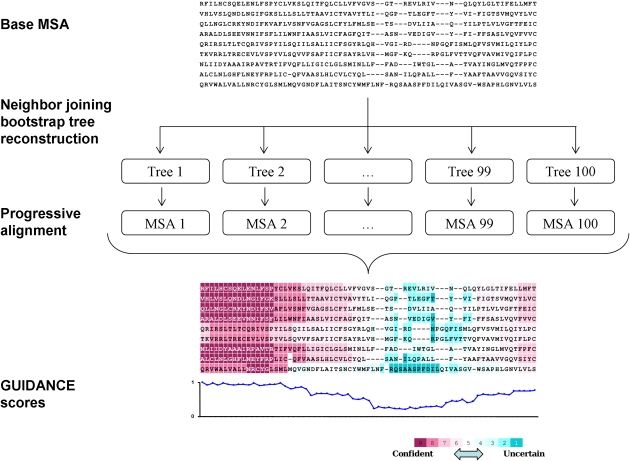
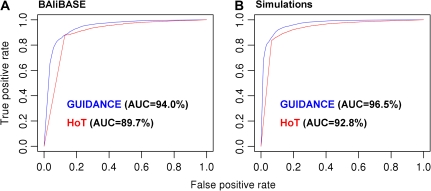
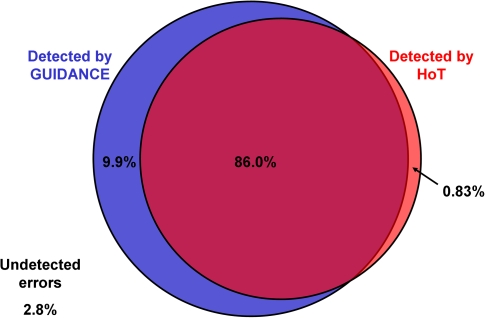
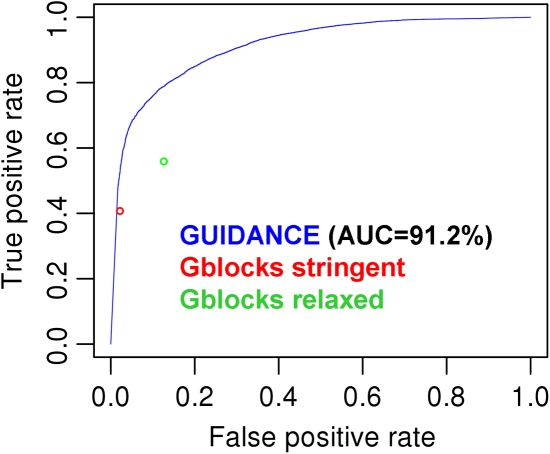
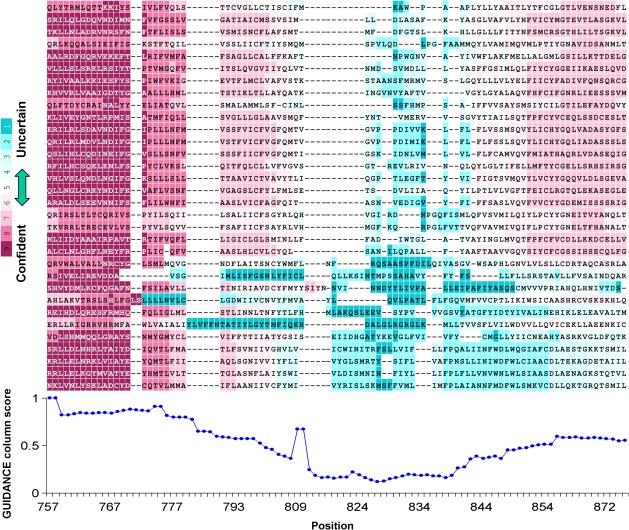
Multiple sequence alignment (MSA) is the basis for a wide range of comparative sequence analyses from molecular phylogenetics to 3D structure prediction. Sophisticated algorithms have been developed for sequence alignment, but in practice, many errors can be expected and extensive portions of the MSA are unreliable. Hence, it is imperative to understand and characterize the various sources of errors in MSAs and to quantify site-specific alignment confidence. In this paper, we show that uncertainties in the guide tree used by progressive alignment methods are a major source of alignment uncertainty. We use this insight to develop a novel method for quantifying the robustness of each alignment column to guide tree uncertainty. We build on the widely used bootstrap method for perturbing the phylogenetic tree. Specifically, we generate a collection of trees and use each as a guide tree in the alignment algorithm, thus producing a set of MSAs. We next test the consistency of every column of the MSA obtained from the unperturbed guide tree with respect to the set of MSAs. We name this measure the "GUIDe tree based AligNment ConfidencE" (GUIDANCE) score. Using the Benchmark Alignment data BASE benchmark as well as simulation studies, we show that GUIDANCE scores accurately identify errors in MSAs. Additionally, we compare our results with the previously published Heads-or-Tails score and show that the GUIDANCE score is a better predictor of unreliably aligned regions.
Figures
Similar articles
-
The effect of the guide tree on multiple sequence alignments and subsequent phylogenetic analyses.Pac Symp Biocomput. 2008:25-36. doi: 10.1142/9789812776136_0004. Pac Symp Biocomput. 2008. PMID: 18229674
-
GUIDANCE2: accurate detection of unreliable alignment regions accounting for the uncertainty of multiple parameters.Nucleic Acids Res. 2015 Jul 1;43(W1):W7-14. doi: 10.1093/nar/gkv318. Epub 2015 Apr 16. Nucleic Acids Res. 2015. PMID: 25883146 Free PMC article.
-
GUIDANCE: a web server for assessing alignment confidence scores.Nucleic Acids Res. 2010 Jul;38(Web Server issue):W23-8. doi: 10.1093/nar/gkq443. Epub 2010 May 23. Nucleic Acids Res. 2010. PMID: 20497997 Free PMC article.
-
Molecular Phylogenetics: Concepts for a Newcomer.Adv Biochem Eng Biotechnol. 2017;160:185-196. doi: 10.1007/10_2016_49. Adv Biochem Eng Biotechnol. 2017. PMID: 27783136 Review.
-
Multiple sequence alignment: algorithms and applications.Adv Biophys. 1999;36:159-206. doi: 10.1016/s0065-227x(99)80007-0. Adv Biophys. 1999. PMID: 10463075 Review.
Cited by
-
Early bioenergetic evolution.Philos Trans R Soc Lond B Biol Sci. 2013 Jun 10;368(1622):20130088. doi: 10.1098/rstb.2013.0088. Print 2013 Jul 19. Philos Trans R Soc Lond B Biol Sci. 2013. PMID: 23754820 Free PMC article. Review.
-
Improving multiple sequence alignment by using better guide trees.BMC Bioinformatics. 2015;16 Suppl 5(Suppl 5):S4. doi: 10.1186/1471-2105-16-S5-S4. Epub 2015 Mar 18. BMC Bioinformatics. 2015. PMID: 25859903 Free PMC article.
-
Alignment-Integrated Reconstruction of Ancestral Sequences Improves Accuracy.Genome Biol Evol. 2020 Sep 1;12(9):1549-1565. doi: 10.1093/gbe/evaa164. Genome Biol Evol. 2020. PMID: 32785673 Free PMC article.
-
Molecular evolution of juvenile hormone esterase-like proteins in a socially exchanged fluid.Sci Rep. 2018 Dec 13;8(1):17830. doi: 10.1038/s41598-018-36048-1. Sci Rep. 2018. PMID: 30546082 Free PMC article.
-
Sensitive inference of alignment-safe intervals from biodiverse protein sequence clusters using EMERALD.Genome Biol. 2023 Jul 17;24(1):168. doi: 10.1186/s13059-023-03008-6. Genome Biol. 2023. PMID: 37461051 Free PMC article.
References
-
- Carrillo H, Lipman D. The multiple sequence alignment problem in biology. SIAM J Appl Math. 1988;48:1073–1082.
-
- Castresana J. Selection of conserved blocks from multiple alignments for their use in phylogenetic analysis. Mol Biol Evol. 2000;17:540–552. - PubMed
-
- Fawcett T. An introduction to ROC analysis. Pattern Recog Lett. 2006;27:861–874.
Publication types
MeSH terms
Grants and funding
LinkOut - more resources
Full Text Sources
