. 2010 Apr 30;285(18):13337-48.
doi: 10.1074/jbc.M110.112094. Epub 2010 Mar 5.

Isoproterenol and cAMP block ERK phosphorylation and enhance [Ca2+]i increases and oxygen consumption by muscarinic receptor stimulation in rat parotid and submandibular acinar cells

Affiliations

Isoproterenol and cAMP block ERK phosphorylation and enhance [Ca2+]i increases and oxygen consumption by muscarinic receptor stimulation in rat parotid and submandibular acinar cells

Stephen P Soltoff et al. J Biol Chem. .

Abstract

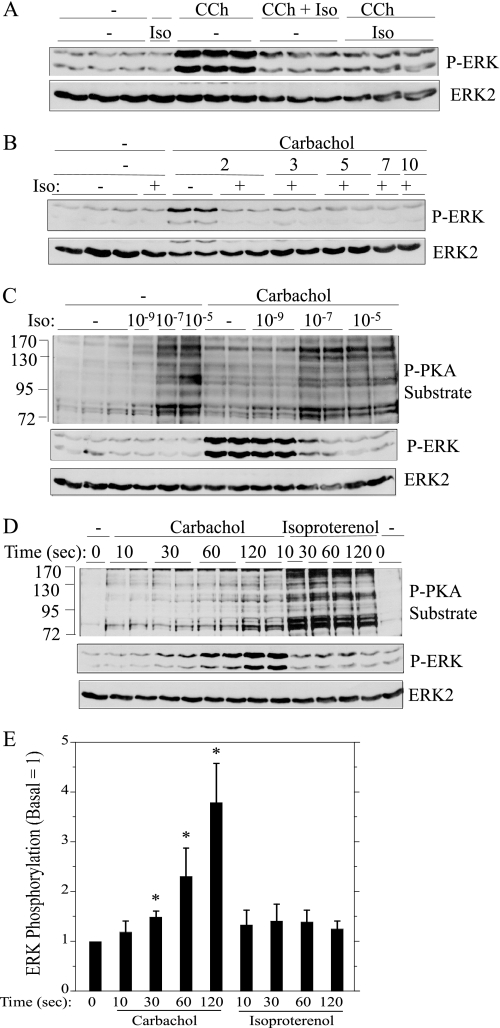
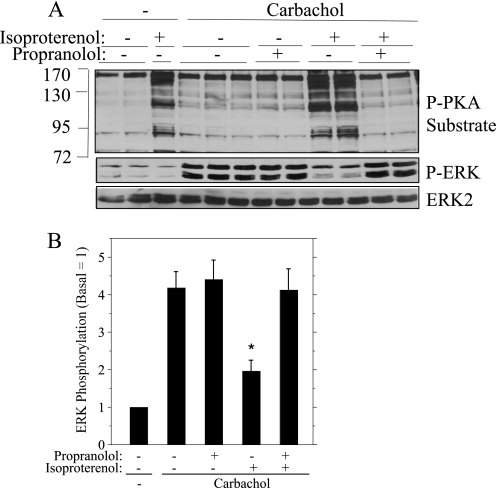
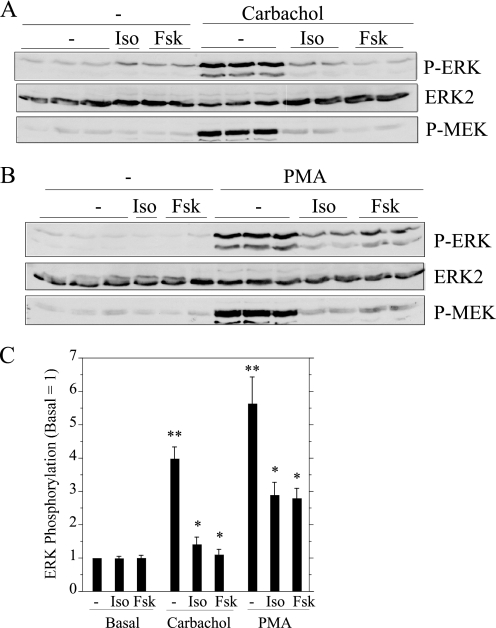
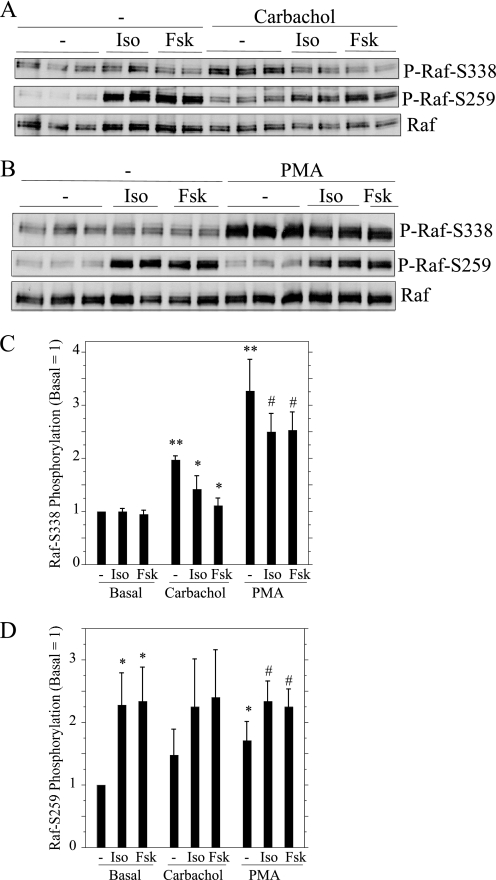
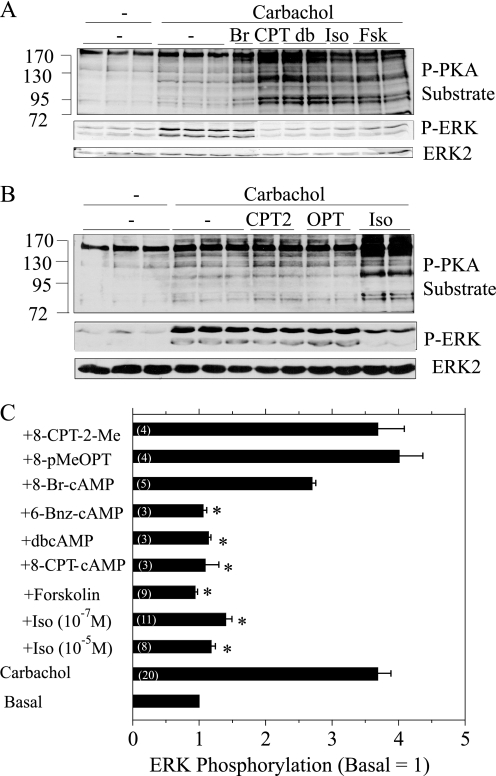
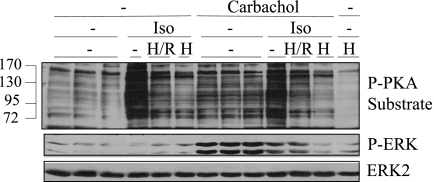
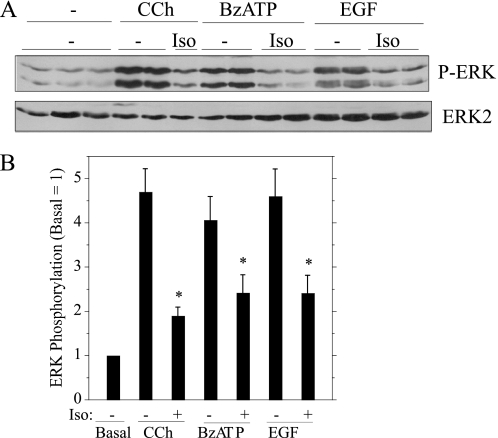
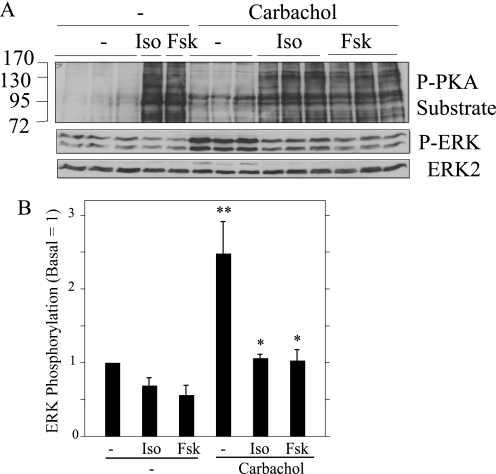
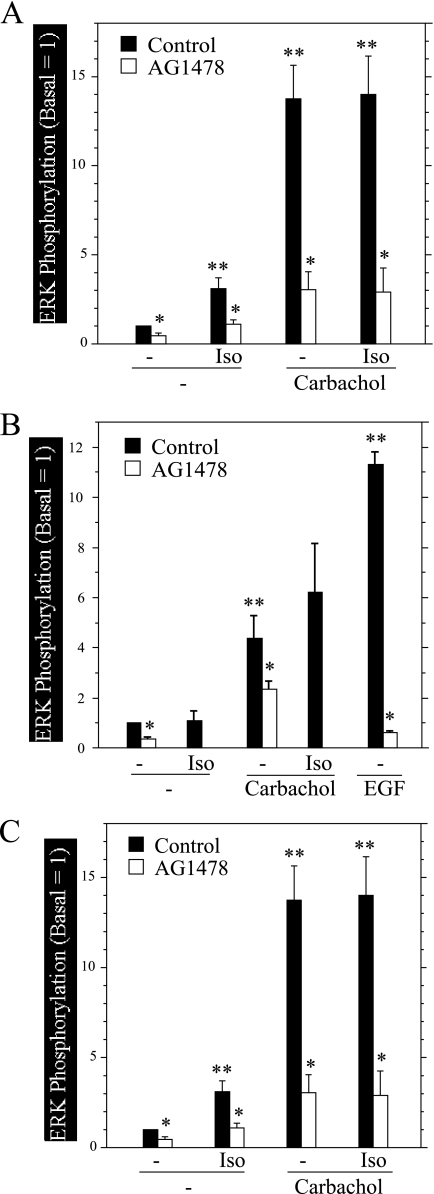
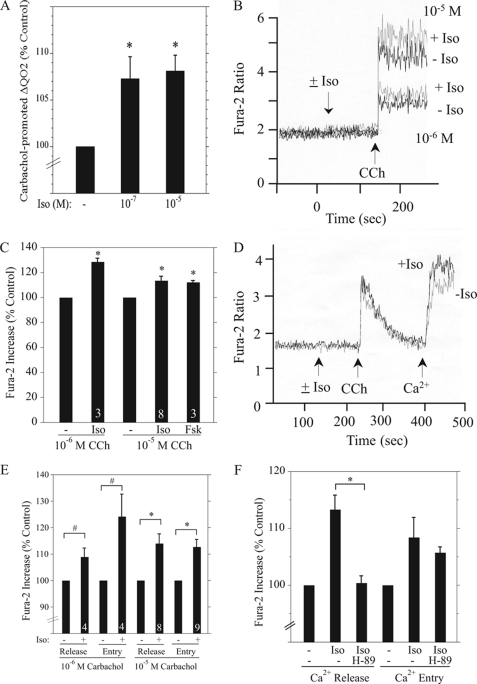
Salivary glands are innervated by sympathetic and parasympathetic neurons, which release neurotransmitters that promote fluid secretion and exocytosis when they bind to muscarinic and beta-adrenergic receptors, respectively. Signaling pathways downstream of these receptors are mainly distinct, but there is cross-talk that affects receptor-dependent events. Here we report that the beta-adrenergic ligand isoproterenol blocks increases in extracellular signal-related kinase (ERK) phosphorylation, a protein kinase C-dependent event promoted by the muscarinic receptor ligand carbachol in freshly dispersed rat parotid acinar cells. The inhibitory action of isoproterenol was reproduced by cAMP stimuli (forskolin) and mimetics (dibutyryl-cAMP, 8-(4-chlorophenylthio)-cAMP), including one highly selective for protein kinase A (N(6)-benzoyl-cAMP). In contrast, Epac (exchange proteins directly activated by cAMP)-selective activators did not mimic the blockade of ERK by isoproterenol, suggesting that inhibition involved protein kinase A. Isoproterenol also blocked ERK downstream of phorbol 12-myristate 13-acetate and the P2X(7) and epidermal growth factor receptors. Isoproterenol and forskolin blocked MEK phosphorylation, reduced RAF phosphorylation on a stimulatory site (Ser-338), and increased RAF phosphorylation on an inhibitory site (Ser-259). Inhibitory effects on ERK were also observed in freshly dispersed rat submandibular acinar cells but not in three immortalized/cancer salivary cell lines (Par-C10, HSY, HSG), indicating significant differences between native cells and cell lines. Notably, in native parotid cells isoproterenol enhanced the carbachol-promoted increases in [Ca(2+)](i) and oxygen consumption, events that initiate and accompany, respectively, the stimulation of fluid secretion by muscarinic ligands. Thus, isoproterenol produces opposite effects on prominent events downstream of the muscarinic receptor second messengers diacylglycerol (decrease in ERK phosphorylation) and inositol trisphosphate (increase in [Ca(2+)](i) and fluid secretion).


Figures

FIGURE 1.
FIGURE 1.
Isoproterenol blocks the phosphorylation of ERK by carbachol in rat parotid acinar cells. A, cells were pretreated (or not) with 10−7 m isoproterenol (Iso) for 1 min and then exposed for 2 min to 10−5 m carbachol (CCh) alone or in combination with 10−7 m isoproterenol. B, cells were pretreated (or not) with 10−7 m isoproterenol for 1 min and then exposed for to 10−5 m carbachol for periods of time between 2–10 min. C, cells were pretreated with 10−9–10−5 m isoproterenol for 1 min and then exposed to 10−5 m carbachol for 2 min. D, cells were exposed to carbachol (10−5 m) and isoproterenol (10−7 m) for the times indicated. E, shown is quantification of ERK phosphorylation relative to the basal control (no addition) for conditions shown in D. *, p < 0.05, n = 3–4. In A–C, cells exposed only to isoproterenol were treated for 3 min. Cell lysates were subjected to immunoblot analysis as indicated.
FIGURE 2.
FIGURE 2.
The β-adrenergic receptor antagonist propranolol blocks the effects of isoproterenol on rat parotid acinar cells. Where indicated, cells were pretreated (or not) with propranolol (10−6 m) for 3 min before carbachol (10−5 m, 2 min) alone or preceded by isoproterenol (10−7 m, 1 min). A, cell lysates were subjected to immunoblot analysis as indicated. B, quantification of ERK phosphorylation relative to the basal control (no addition) for conditions shown in A. n = 5. *, p < 0.01 versus carbachol (no additions).
FIGURE 3.
FIGURE 3.
Inhibitory effects of isoproterenol and forskolin on the phosphorylation of ERK and MEK in carbachol- and PMA-treated rat parotid acinar cells. Cells were pretreated with 10−5 m isoproterenol (Iso) for 1 min and 10−5 m forskolin (Fsk) for 10 min and then exposed to 10−5 m carbachol (A) and 100 nm PMA (B) for 2 min. Cells not exposed to stimuli were exposed to isoproterenol for 3 min and forskolin for 12 min. Cell lysates were subjected to immunoblot analysis as indicated. C, shown is quantification of ERK phosphorylation relative to the basal control (no addition). n = 7–12. **, p < 0.01 versus basal. *, p < 0.01 versus stimulus control.
FIGURE 4.
FIGURE 4.
Effects of isoproterenol (Iso) and forskolin (Fsk) on the phosphorylation of RAF in carbachol- and PMA-treated rat parotid acinar cells. A and B, cells were exposed to agents as in Fig. 3. Cell lysates were used to immunoprecipitate c-RAF-1, which was subjected to immunoblot analysis using two different phospho-RAF antibodies and c-RAF-1, as indicated. C and D, quantification of RAF phosphorylation on Ser-338 (C) and Ser-259 (D) were calculated relative to the basal control (no additions). For C, n = 6–7. **, p < 0.01 versus basal; *p < 0.01 versus carbachol control; #, p < 0.03 versus PMA control. For D, n = 5. *, p < 0.03 versus basal control; #, p < 0.01 versus basal control.
FIGURE 5.
FIGURE 5.
Effect of PKA and Epac activators on the phosphorylation of PKA substrates and ERK in rat parotid acinar cells. A, cells were exposed to 8-Br-cAMP (Br, 1 mm, 15 min), 8-CPT-cAMP (CPT, 1 mm, 15 min), dibutyryl-cAMP (db, 1 mm, 15 min), isoproterenol (Iso, 10−7 m, 1 min), and forskolin (Fsk, 10−5 m, 1 min) followed by exposure to carbachol (10−5 m, 2 min). Lysates were subjected to immunoblot analysis as indicated. B, cells were exposed to 8-CPT-2′-Me-cAMP (CPT2, 100 μm, 15–30 min), 8-pMeOPT-2′-O-Me-cAMP (OPT, 100 μm, 30 min), and isoproterenol (Iso, 10−7 m, 1 min) followed by exposure to carbachol (10−5 m, 2 min). Lysates were subjected to immunoblot analysis as indicated. C, quantification of changes in ERK phosphorylation. Shown are the values for basal, carbachol (10−5 m, 2 min), and agents added before carbachol as in A and B in addition to 6-Bnz-cAMP (10 μm, 20 min). 8-CPT-2-Me is 8-CPT-2′-O-Me-cAMP; 8-pMeOPT is 8-pMeOPT-2′-O-Me-cAMP. Changes in ERK phosphorylation are presented relative to the basal control (no additions). Numbers in parentheses indicate the number of experiments. *, p < 0.05 versus carbachol alone.
FIGURE 6.
FIGURE 6.
Effect of PKA inhibitors on PKA substrate phosphorylation and ERK phosphorylation in rat parotid acinar cells. Where indicated, cells were exposed to 10 μm H-89/30 μm Rp-cAMPs (H/R) or 30 μm H-89 (H) for 20 min, and then exposed to isoproterenol (10−5 m) for 1 min followed by carbachol (10−5 m) for 2 min. Lysates were subjected to immunoblot analysis as indicated.
FIGURE 7.
FIGURE 7.
Isoproterenol blocks ERK phosphorylation downstream of different types of receptors in rat parotid acinar cells. A, cells were exposed to isoproterenol (Iso) (10−7 m) for 1 min followed by carbachol (CCh, 10−5 m), BzATP (10 μm), and EGF (100 ng/ml) for 2 min. Lysates were subjected to immunoblot analysis as indicated. B, shown are quantifications of changes in ERK phosphorylation relative to the basal control (no additions). n = 6–8. *, p < 0.01.
FIGURE 8.
FIGURE 8.
Isoproterenol and forskolin block the phosphorylation of ERK by carbachol in rat submandibular acinar cells. A, cells were pretreated (or not) with isoproterenol (Iso, 10−5 m) and forskolin (Fsk, 10−5 m) for 1 min and then exposed to carbachol (10−5 m, 2 min). Cells not exposed to carbachol were exposed to isoproterenol and forskolin for 3 min. Lysates were subjected to immunoblot analysis as indicated. B, shown is quantification of the effects of isoproterenol and forskolin on ERK phosphorylation relative to the basal control (no additions). n = 3. *, p < 0.05 versus carbachol (no addition). **, p < 0.05 versus basal.
FIGURE 9.
FIGURE 9.
Effects of isoproterenol, forskolin, and AG1478 on the phosphorylation of ERK by carbachol in rat and human salivary gland cell lines. Cells were exposed to AG1478 (300 nm) for 20 min before stimuli and to isoproterenol (Iso, 10−4 m) and forskolin (10−5 m) for times as indicated below. Cells were exposed to carbachol (10−4 m) and EGF (100 ng/ml) for 3 min. A, HSY cells were treated (or not) with isoproterenol (2 min) followed by carbachol. Cells not exposed to carbachol were treated with isoproterenol for 5 min. n = 3. *, p < 0.05 versus the same conditions without AG1478. **, p < 0.05 versus basal control. B, HSG cells were treated (or not) with isoproterenol for 12 min followed by carbachol. Cells not exposed to carbachol were treated with isoproterenol for 15 min. n = 3–7. *, p < 0.01 versus the same conditions without AG1478. **, p < 0.01 versus basal control. C, C10 cells were treated (or not) with isoproterenol (2 min) and forskolin (10 min) and then exposed to carbachol. Cells not exposed to carbachol were exposed to isoproterenol for 5 min and forskolin for 15 min. n = 3–10. *, p < 0.03 versus same condition with AG1478. p < 0.03 versus basal control.
FIGURE 10.
FIGURE 10.
Isoproterenol enhances carbachol-promoted increases in QO2 and [Ca2+]i in rat parotid acinar cells. A, shown are increases (ΔQO2) in the rate of O2 consumption of parotid cells exposed to 10−5 m carbachol in cells pretreated (or not) with 10−7 m and 10−5 m isoproterenol (Iso) for 2 min before carbachol. The rates in the presence of isoproterenol were normalized to the control ΔQO2 value (18.9 ± 0.4 nmol of O2/mg of protein/min, n = 3) in the presence of carbachol alone (−). n = 3. *, p < 0.05. B, increases in intracellular Ca2+ in cells suspended in Ca2+-containing Solution A and stimulated with 10−6 and 10−5 m carbachol (CCh) in the presence (+Iso) or absence (−Iso) of 10−5 m isoproterenol. Shown are individual traces from one experiment. The ordinate axis is the 340/380-nm Fura-2 fluorescence excitation ratio. C, cumulative data show the stimulatory effects of isoproterenol (10−5 m) and forskolin (10−5 m) on the initial peak Ca2+ increase produced by carbachol (10−6 m, 10−5 m), as shown in B. Data were normalized to the increases in the Fura-2 ratio produced by carbachol alone (10−6 m, 1.06 ± 0.12, n = 3; 10−5 m, 2.34 ± 0.13, n = 8). Numbers at the bottom of the bars indicate number of experiments. *, p < 0.01 versus control. D, shown is the stimulatory effect of isoproterenol (10−5 m) on intracellular Ca2+ release promoted by 10−5 m carbachol in Fura-2-loaded cells suspended in Ca2+-free Solution A and the entry of Ca2+ when CaCl2 (1 mm) was added to cells after depletion of Ca2+ stores. Shown are individual traces from one experiment. The ordinate axis is the 340/380-nm Fura-2 fluorescence excitation ratio. E, cumulative data show the stimulatory effects of isoproterenol (10−5 m) on the peak Ca2+ increase due to carbachol-promoted Ca2+ release and the subsequent Ca2+ peak due to Ca2+ entry as shown in D. Increases in the Fura-2 ratio from isoproterenol-treated cells were normalized to the increases produced in the absence of isoproterenol (10−6 m, release, 0.74 ± 0.05, n = 4; entry, 1.32 ± 0.21, n = 4; 10−5 m, release, 1.28 ± 0.10, n = 8; entry, 2.05 ± 0.13, n = 9). *, p < 0.01 versus control; #, p < 0.05 versus control. F, cumulative data show the effect of treatment of cells with H-89 (2 μm, 10 min) before initiating the stimulatory effect of isoproterenol on the carbachol (10−5 m)-promoted Ca2+ release and uptake as shown in D. *, p < 0.05. n = 4.

Similar articles

Cited by

References

    1. Proctor G. B., Carpenter G. H. (2007) Auton. Neurosci. 133, 3–18 - PubMed
    1. Dai Y. S., Ambudkar I. S., Horn V. J., Yeh C. K., Kousvelari E. E., Wall S. J., Li M., Yasuda R. P., Wolfe B. B., Baum B. J. (1991) Am. J. Physiol. 261, C1063–C1073 - PubMed
    1. Melvin J. E., Yule D., Shuttleworth T., Begenisich T. (2005) Annu. Rev. Physiol. 67, 445–469 - PubMed
    1. Yoshimura K., Murakami M., Segawa A. (2000) J. Physiol. 522, 403–416 - PMC - PubMed
    1. Chaudhuri A., Husain S. Z., Kolodecik T. R., Grant W. M., Gorelick F. S. (2007) Am. J. Physiol. Gastrointest. Liver Physiol. 292, G1403–D1410 - PMC - PubMed

Publication types

MeSH terms