. 2010 May 21;285(21):15682-95.
doi: 10.1074/jbc.M109.092270. Epub 2010 Mar 5.

Insulin-like growth factor-I-stimulated insulin receptor substrate-1 negatively regulates Src homology 2 domain-containing protein-tyrosine phosphatase substrate-1 function in vascular smooth muscle cells

Affiliations

Insulin-like growth factor-I-stimulated insulin receptor substrate-1 negatively regulates Src homology 2 domain-containing protein-tyrosine phosphatase substrate-1 function in vascular smooth muscle cells

Yashwanth Radhakrishnan et al. J Biol Chem. .

Abstract

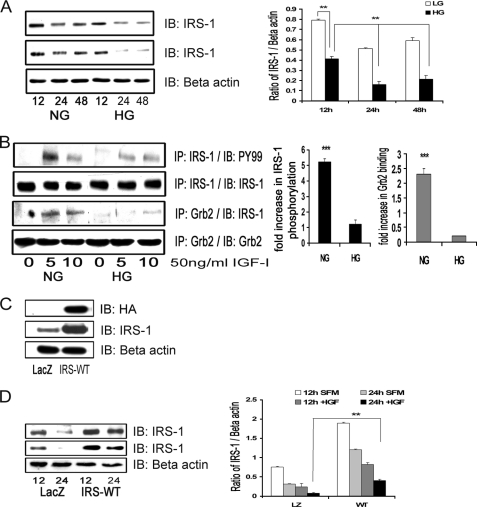
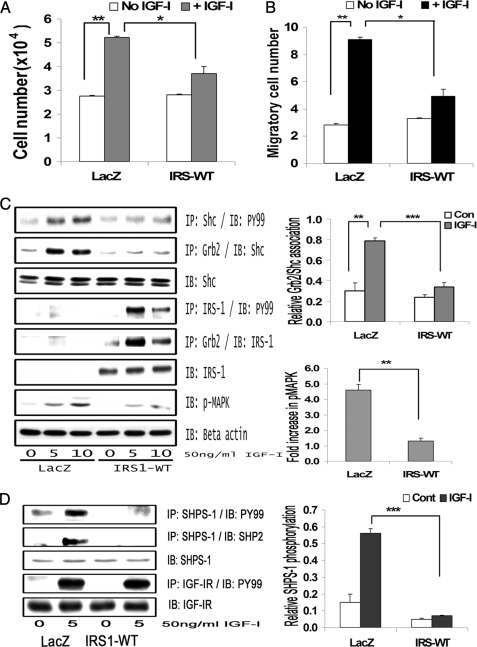
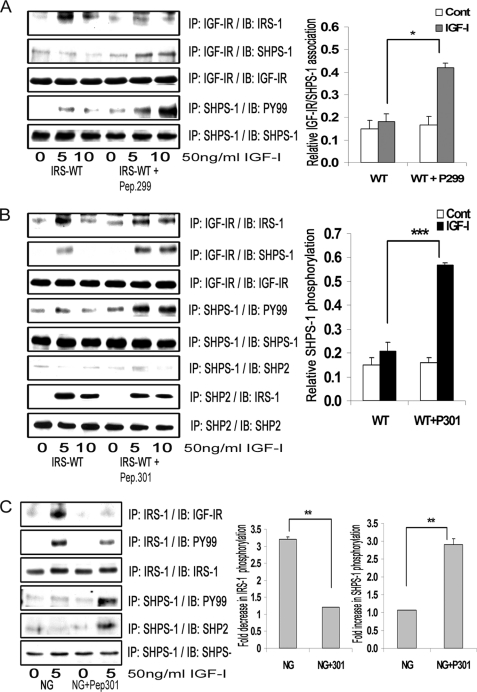
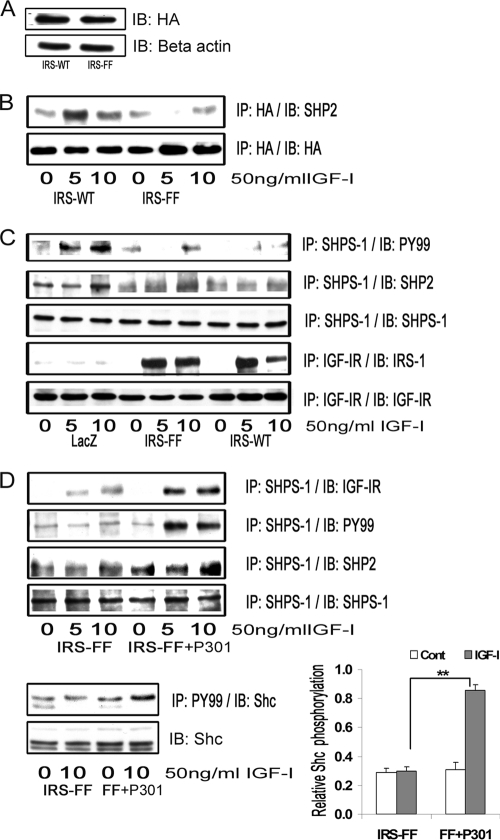
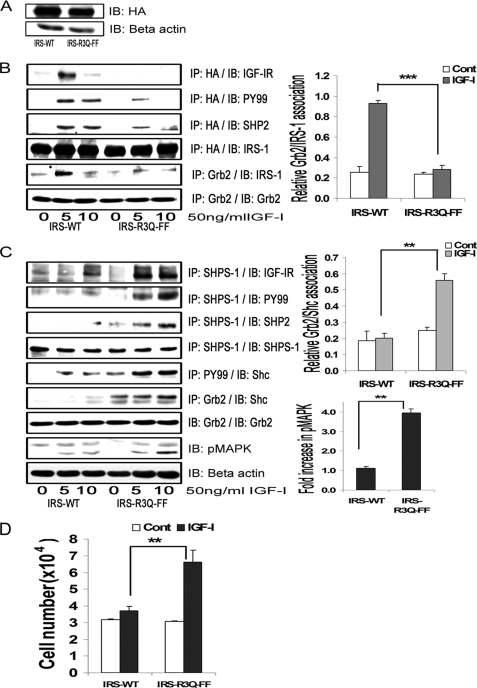
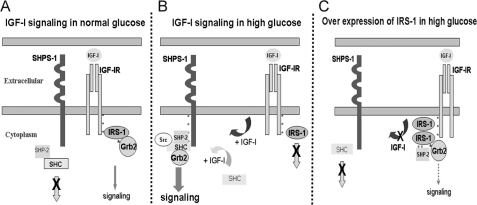
Vascular smooth muscle cells maintained in normal (5.6 mm) glucose respond to insulin-like growth factor-I (IGF-I) with increased protein synthesis but do not proliferate. In contrast, hyperglycemia alters responsiveness to IGF-I, resulting in increased SHPS-1 phosphorylation and assembly of a signaling complex that enhances MAPK and phosphatidylinositol 3-kinase pathways. Hyperglycemia also reduces the basal IRS-1 concentration and IGF-I-stimulated IRS-1-linked signaling. To determine if failure to down-regulate IRS-1 alters vascular smooth muscle cell (VSMC) responses to IGF-I, we overexpressed IRS-1 in VSMCs maintained in high glucose. These cultures showed reduced SHPS-1 phosphorylation, transfer of SHP-2 to SHPS-1, and impaired Shc and MAPK phosphorylation and cell proliferation in response to IGF-I. In vitro studies demonstrated that SHPS-1 was a substrate for type I IGF receptor (IGF-IR) and that IRS-1 competitively inhibited SHPS-1 phosphorylation. Exposure of VSMC cultures to a peptide that inhibited IRS-1/IGF-IR interaction showed that IRS-1 binding to IGF-IR impairs SHPS-1 phosphorylation in vivo. IRS-1 also sequestered SHP-2. Expression of an IRS-1 mutant (Y1179F/Y1229F) reduced IRS-1/SHP-2 association, and exposure of cells expressing the mutant to the inhibitory peptide enhanced SHPS-1 phosphorylation and SHP-2 transfer. This result was confirmed by expressing an IRS-1 mutant that had both impaired binding to IGF-IR and to SHP-2 IGF-I increased SHPS-1 phosphorylation, SHP-2 association with SHPS-1, Shc MAPK phosphorylation, and proliferation in cells expressing the mutant. We conclude that IRS-1 is an important factor for maintaining VSMCs in the non-proliferative state and that its down-regulation is a component of the VSMC response to hyperglycemic stress that results in an enhanced response to IGF-I.


Figures

FIGURE 1.
FIGURE 1.
Hyperglycemia decreases total IRS-1 protein levels and IRS-1-mediated signaling. A, confluent VSMC cultures were maintained in medium containing 5 mm (NG) or 25 mm (HG) glucose prior to these analyses. They were changed to serum-free medium containing the same glucose concentration for 12, 24, or 48 h without (top) or with (second panel) IGF-I (50 ng/ml). The anti-β-actin antibody (loading control) is shown in the lower panel. After cell lysis, aliquots containing equal amounts of protein were separated directly by SDS-PAGE and immunoblotted (IB) with anti-IRS-1 antibody. The bar graph is representative of three independent experiments without IGF-I. Error bars, mean ± S.E. **, p < 0.01. B, the extent of IRS-1 tyrosine phosphorylation was determined by immunoprecipitating (IP) cell lysates with an anti-IRS-1 antibody and then immunoblotting with an anti-Tyr(P)99 (PY99) antibody (first panel), and Grb-2 association with IRS-1 was determined by immunoprecipitating with an anti-Grb2 antibody and then immunoblotting with anti-IRS-1 antibody (third panel). The membranes were stripped and reprobed with either anti-IRS-1 or anti-Grb2 antibody to detect the total levels of IRS-1 (second panel) or Grb2 (fourth panel), respectively. The amount of immunoprecipitate analyzed was adjusted to correct for differences in total IRS-1 between the NG and HG cultures. The bar graph represents three independent experiments. Error bars, mean ± S.E. ***, p < 0.001 when the amount of tyrosine phosphorylation of IRS-1 or the amount of Grb2 associated with IRS-1 at 5 min in response to IGF-I is compared between NG and HG cultures. C, VSMCs expressing either LacZ or IRS-WT were serum-starved in DMEM-HG and analyzed for recombinant protein expression. Cell lysates were immunoblotted using an anti-HA antibody (top), anti-IRS-1 antibody (middle), and an anti-β-actin antibody loading control (bottom). D, confluent VSMCs expressing LacZ or IRS-WT cultured in HG were serum-deprived and stimulated without or with IGF-I (50 ng/ml) for 12 or 24 h. Equal amounts of protein were separated by SDS-PAGE and immunoblotted with anti-IRS-1 antibody (without IGF-I (top) or with IGF-I (middle)) or with anti-β-actin antibody (bottom). The bar graph is representative of three independent experiments. Error bars, mean ± S.E. **, p < 0.01.
FIGURE 2.
FIGURE 2.
IRS-1 overexpression impairs IGF-I-mediated SHPS-1 phosphorylation and subsequent SHPS-1 complex assembly, leading to reduction in phosphorylation of MAPK and cellular proliferation. A, LacZ and IRS-WT cells were plated (3 × 10⁴ cells) in DMEM-HG with 2% FBS prior to exposure to IGF-I in DMEM-HG with 0.2% platelet-poor plasma. Forty-eight hours after the addition of IGF-I, the cell number was determined. **, p < 0.01 when the change in cell number in response to IGF-I in LacZ control cells is determined; *, p < 0.05 when the number of cells proliferating after exposure to IGF-I is compared between LacZ and IRS-WT cells. Error bars, mean ± S.E. B, LacZ and IRS-WT cells were grown in 6-well dishes in DMEM-HG containing 10% FBS. After wounding, they were allowed to migrate with or without IGF-I in medium containing 0.2% FBS for 48 h. The total number of cells migrating past the wound line in the predetermined areas was counted. The results shown are the mean ± S.E. of at least three independent experiments. **, p < 0.01 when the change in migrating cells in response to IGF-I in LacZ cells is compared with LacZ cells without IGF-I; *, p < 0.05 when the number of cells migrating in response to IGF-I is compared between LacZ and IRS-WT cells. C, confluent LacZ and IRS-WT cells were serum-starved for 16 h in DMEM-HG and then exposed to IGF-I for the times indicated. The extent of Shc and IRS-1 phosphorylation was determined by immunoprecipitating (IP) p52shc (first panel) or IRS-1 (fourth panel) and then immunoblotting (IB) with an anti-phosphotyrosine (Tyr(P)99 (PY99)) antibody. Similarly, the lysates were immunoprecipitated with anti-Grb2 antibody, and the bottom portion of the blot was used for immunoblotting for p52shc (second panel), whereas the top portion of the same blot was immunoblotted for IRS-1 (fifth panel). An equal amount of protein from cell lysates from the same experiment was used to immunoblot for total Shc (third panel) and total IRS-1 (sixth panel). Similarly, an equal amount of protein from the same cell lysates was immunoblotted using anti-phospho-MAPK (seventh panel). The blots were stripped and reprobed using anti-β-actin antibody (bottom panel). The bar graphs are representative of at least three independent experiments and two independent transductions. Error bars, mean ± S.E. ***, p < 0.001 when the amount of Grb2 associated with Shc at 10 min in response to IGF-I is compared between LacZ and IRS-WT cells; **, p < 0.01 when the amount of phosphorylation of MAPK in response to IGF-I at 10 min is compared between LacZ and IRS-WT cells. D, confluent LacZ- and IRS-WT-expressing cells were serum-starved for 16 h in DMEM-HG and then exposed to IGF-I for 5 min, and the extent of SHPS-1 phosphorylation and SHP-2 association was determined by immunoprecipitating with an anti-SHPS-1 antibody and immunoblotting with Tyr(P)99 (first panel) or with anti-SHP-2 antibody (second panel). The extent of IGF-IR tyrosine phosphorylation was assessed by immunoprecipitating IGF-IR and immuoblotting for phosphotyrosine (fourth panel). Lysates from the same experiments were immunoblotted for total SHPS-1 (third panel) or for total IGF-IR (fifth panel). The bar graph shows the relative increase in SHPS-1 phosphorylation for at least three independent experiments. Error bars, mean ± S.E. ***, p < 0.001 when increase in SHPS-1 phosphorylation in response to IGF-I is compared between LacZ- and IRS-WT-expressing cells.
FIGURE 3.
FIGURE 3.
IGF-IR kinase phosphorylates SHPS-1 and IRS-1 binding to IGF-IR impairs its ability to phosphorylate SHPS-1 in cells and in a cell-free system. A, SHPS-1/CD generated by in vitro translation using wheat germ extract was incubated in vitro (denoted by the plus or minus sign) with or without activated IGF-IR kinase as described under “Materials and Methods.” The supernatant was analyzed by immunoblotting (IB) for phosphotyrosine (top) or SHPS-1 (bottom). The relative -fold increase in the phosphorylation of SHPS-1/CD is shown in the bar graph. Error bars, mean ± S.E. ***, p < 0.001. B, confluent LacZ and IGF-IR-WT cells were serum-starved for 16 h in DMEM-HG and exposed to IGF-I for 5 min. The extent of SHPS-1 phosphorylation was determined by immunoprecipitating (IP) SHPS-1 and immunoblotting with Tyr(P)99 (first panel). Lysates from the same experiments were immunoblotted for total SHPS-1 (second panel). C, in similar experiments, additional samples that contained IGF-IR and SHPS-1/CD were exposed to the IGF-IR tyrosine kinase inhibitor, PQ401 15 μm (lane 3) or 50 μm (lane 5), and vehicle control (DMSO) was added to lanes 2 and 4. Half of the supernatant was analyzed by immunoblotting using Tyr(P)99 (PY99) antibody representing IGF-IR phosphorylation (top) and SHPS-1/CD phosphorylation (bottom). Both bands were identified by electrophoretic mobility. The other half of the supernatant was analyzed by immunoblotting for total IGF-IR and total SHPS-1 (lower panels). The relative -fold increase in the SHPS-1/CD phosphorylation and suppression by the inhibitor is shown in the bar graph. Error bars, mean ± S.E. ***, p < 0.001. D, VSMCs cultured and maintained in DMEM-HG were serum-starved and then incubated with or without PQ401 (50 μm) for 1 h. IGF-I was added for 5 min. Cell lysates were immunoprecipitated with anti-IGF-IR antibody (first panel) or with anti-SHPS-1 antibody (second panel) and immunoblotted for Tyr(P)99. Cell lysates were immunoblotted with anti-IGF-IR (third panel) or anti-SHPS-1 antibody (fourth panel). E, confluent IGF-IR-overexpressing cells were serum-starved for 16 h in DMEM-HG and then exposed to IGF-I for the times indicated. The cell lysates were immunoprecipitated with anti-IGF-IR antiserum. Some aliquots of reconstituted immunoprecipitate were incubated with SHPS-1/CD in in vitro phosphorylation assays (lanes 1–3) or with buffer alone (Con). After centrifugation, the resultant supernatants were immunoblotted using a phosphotyrosine antibody IGF-IR (top) or phospho-SHPS-1/CD (middle). Similar lysates were immunoprecipitated and immunoblotted with anti-IGF-IR antibody as a loading control (bottom). To ascertain the specificity of the bands, an antibody only control was also used. The bar graph represents the relative increase in SHPS-1/CD phosphorylation in response to IGF-I at 10 min compared with non-stimulated immunoprecipitates; ***, p < 0.001 based on at least three independent experiments. Error bars, mean ± S.E. F, in an in vitro assay, the SHPS-1/CD and activated IGF-IR were incubated with increasing concentrations of recombinant full-length IRS-1, 20 ng (lane 3) and 40 ng (lane 4), for 30 min. An aliquot of each supernatant was analyzed by immunoblotting with an anti-phosphotyrosine antibody that recognizes IGF-IR tyrosine phosphorylation (top) or SHPS-1/CD (middle). The third panel indicates the total SHPS-1/CD. The -fold increase in SHPS-1/CD phosphorylation in response to IGF-IR is shown in the bar graph. Error bars, mean ± S.E. ***, p < 0.001. The -fold decrease in SHPS-1 phosphorylation in the presence of 40 ng of IRS-1 (lane 4) is shown (bar graph) in comparison with no IRS-1 addition (lane 2). Error bars, mean ± S.E.; **, p < 0.01.
FIGURE 4.
FIGURE 4.
Inhibition of IRS-1 binding to IGF-IR increases association of SHPS-1 with IGF-IR and increases SHPS-1 phosphorylation. A and B, confluent cultures expressing WT-IRS-1 were serum-starved overnight and then incubated with or without cell-permeable peptides, IGF-IR (peptide 299) (A) or IRS-1 (peptide 301) (B) at 20 μg/ml for 2 h. IGF-I was added for either 5 or 10 min. Cell lysates were immunoprecipitated (IP) with anti-IGF-IR antibody and then immunoblotted for IRS-1 (top panel) or for SHPS-1 (second panel). The blots were stripped and reprobed with anti-IGF-IR antibody (third panel). Cell lysates from the same experiments were immunoprecipitated with anti-SHPS-1 antibody and immunoblotted with Tyr(P)99 antibody (fourth panel). The blots were stripped and reprobed with anti-SHPS-1 antibody (fifth panel). B, in addition, cell lysates were immunoprecipitated with anti-SHPS-1 antibody and immunoblotted for SHP-2 (sixth panel). Similar lysates were immunoprecipitated with anti-SHP-2 antibody and immunoblotted for IRS-1 (seventh panel) or SHP-2 (eighth panel). The top bar graph shows the relative increase in IGF-IR/SHPS-1 association for at least three independent experiments. Error bars, mean ± S.E. *, p < 0.05 when increase in IGF-IR/SHPS-1 association in response to IGF-I at 10 min is compared between IRS-WT cells with and without peptide 299. The middle bar graph shows the relative increase in SHPS-1 phosphorylation for at least three independent experiments. Error bars, mean ± S.E. ***, p < 0.001 when increase in SHPS-1 phosphorylation in response to IGF-I after 10 min is compared in IRS-WT-expressing cells with or without peptide 301. C, VSMCs cultured and maintained in DMEM-NG were serum-starved and then incubated with or without cell-permeable IGF-IR/IRS-1 peptide 301 at a concentration of 5 μg/ml for 2 h. IGF-I was added for 5 min with and without the peptide. Cell lysates from the above experiments were immunoprecipitated with anti-IRS-1 antibody and immunoblotted for either IGF-IR (upper panel) or Tyr(P)99 (second panel). The blots were stripped and reprobed with anti-IRS-1 antibody (third panel). Cell lysates from the same experiments were immunoprecipitated with anti-SHPS-1 antibody and immunoblotted with Tyr(P)99 antibody (fourth panel) or with anti-SHP-2 antibody (fifth panel). The blots were stripped and reprobed with anti-SHPS-1 antibody (sixth panel). The bar graph shows the relative increase in SHPS-1 phosphorylation for at least three independent experiments. Error bars, mean ± S.E. **, p < 0.01 when the increase in SHPS-1 phosphorylation in response to IGF-I is compared with or without peptide 301.
FIGURE 5.
FIGURE 5.
IRS-1 sequesters SHP-2 and impairs its transfer to SHPS-1. A, VSMCs overexpressing IRS-WT and the IRS-FF mutant were serum-starved overnight and analyzed for recombinant protein expression. Cell lysates were immunoblotted (IB) for HA (top) and for β-actin (bottom). B, confluent cultures of IRS-WT and IRS-FF cells were serum-starved for 16 h and then exposed to IGF-I for the times indicated. Cell lysates were immunoprecipitated (IP) with anti-HA and immunoblotted for SHP-2 (top). The membranes were stripped and probed with anti-HA antibody (bottom). C, confluent cultures of control LacZ cells, IRS-WT cells, and IRS-FF cells were serum-starved overnight and stimulated with IGF-I for 5 or 10 min. The cell lysates were immunoprecipitated with anti-SHPS-1 and immunoblotted for Tyr(P)99 (top panel) or SHP-2 (second panel). They were stripped and reprobed with anti-SHPS-1 antibody (third panel). Lysates from similar experiments were immunoprecipitated with anti-IGF-IR and immunoblotted for IRS-1 (fourth panel). The blots were stripped and reprobed for IGF-IR (bottom panel). D, confluent IRS-FF cell cultures were serum-starved for 14–16 h and incubated with or without cell-permeable IGF-IR/IRS-1 peptide 301 (20 μg/ml) for 2 h followed by IGF-I for either 5 or 10 min. Cell lysates were immunoprecipitated with anti-SHPS-1 and immunoblotted for IGF-IR (first panel), Tyr(P)99 (second panel), SHP-2 (third panel), or SHPS-1 (fourth panel). Lysates were immunoprecipitated with Tyr(P)99 (PY99) and immunoblotted with anti-p52shc (fifth panel) or immunoblotted directly for total Shc (bottom panel). The bar graph shows the relative increase in Shc phosphorylation for at least three independent experiments. Error bars, mean ± S.E. **, p < 0.01 when increase in Shc phosphorylation in response to IGF-I is compared between IRS-FF mutant cells with or without peptide 301.
FIGURE 6.
FIGURE 6.
Inhibition of IRS-1 binding to both IGF-IR and SHP-2 restores SHPS-1 phosphorylation and SHPS-1 complex assembly and enhances the cellular proliferation response to IGF-I. A, VSMCs expressing IRS-WT and the IRS-R3Q-FF mutant were serum-starved overnight and analyzed for recombinant protein expression. Cell lysates were immunoblotted (IB) for HA (top) or β-actin (bottom). B, confluent cultures of IRS-WT and IRS-R3Q-FF cells were serum-starved and then exposed to IGF-I for the indicated time periods. Cell lysates were immunoprecipitated (IP) with anti-HA and immunoblotted for IGF-IR (top panel), Tyr(P)99 (PY99; second panel), SHP-2 (third panel), or total HA (fourth panel). Cell lysates from similar experiments were immunoprecipitated with Grb2 and immunoblotted for IRS-1 (fifth panel) or total Grb2 (sixth panel). The bar graphs are representative of at least three independent experiments. Error bars, mean ± S.E. ***, p < 0.001 when the amount of Grb2 associated with IRS-1 at 5 min in response to IGF-I is compared between IRS-WT and IRS-R3Q-FF cells. C, the cell lysates from the above experiments and similar experiments were immunoprecipitated with anti-SHPS-1 antibody and immunoblotted for IGF-IR (top panel), phosphotyrosine (second panel), SHP-2 (third panel), or total SHPS-1 (fourth panel). Similarly, lysates were immunoprecipitated with Tyr(P)99 antibody and immunoblotted for p52shc (fifth panel). Similar lysates were immunoprecipitated with anti-Grb2 and immunoblotted for Shc (sixth panel) or Grb2 (seventh panel). Ten micrograms of protein from the same cell lysates was immunoblotted directly for phospho-MAPK (eighth panel) or β-actin (bottom panel). The bar graphs are representative of at least three independent experiments. Error bars, mean ± S.E. **, p < 0.01 when the amount of Grb2 associated with Shc (middle graph) or amount of phosphorylation of MAPK (bottom graph) at 10 min in response to IGF-I is compared between IRS-WT and IRS-R3Q-FF cells. D, IRS-WT and IRS-R3Q-FF cells were plated (3 × 10⁴ cells) in DMEM-HG with 2% FBS prior to exposure to IGF-I in DMEM-HG with 0.2% platelet-poor plasma. Forty-eight hours after the addition of IGF-I, cell number was determined. **, p < 0.01 when the change in number of cells proliferating in response to IGF-I is compared between IRS-WT and IRS-R3Q-FF cells. Error bars, mean ± S.E.
FIGURE 7.
FIGURE 7.
Proposed role of IRS-1 in regulating SHPS-1 phosphorylation under hyperglycemic conditions. A, in VSMCs under normal glucose conditions, in response to IGF-I, competitive binding of IRS-1 to IGF-IR impairs the access of SHPS-1 to IGF-I receptor kinase, thereby decreasing SHPS-1 phosphorylation. Further, IRS-1 sequesters SHP-2, leading to impaired assembly of the signaling complex on SHPS-1. B, in high glucose conditions, reduction in IRS-1 levels allows SHPS-1 improved access to the IGF-I receptor kinase, leading to enhanced phosphorylation of SHPS-1 and subsequent SHP-2 transfer. This facilitates formation of the SHP-2·Src·Shc·Grb-2 signaling complex, which augments phosphatidylinositol 3-kinase and MAPK pathway activation. C, overexpression of IRS-1 decreases SHPS-1 access to the IGF-IR kinase, SHPS-1 phosphorylation, and subsequent complex assembly. The IRS-1 double mutant with impaired binding to IGF-IR and SHP-2 allows increased SHPS-1 access to IGF-IR kinase, thus increasing SHPS-1 phosphorylation and SHP-2 transfer, thereby leading to increased phosphorylation of MAPK and cellular proliferation in response to IGF-I.

Similar articles

Cited by

References

    1. Imai Y., Clemmons D. R. (1999) Endocrinology 140, 4228–4235 - PubMed
    1. Ling Y., Maile L. A., Lieskovska J., Badley-Clarke J., Clemmons D. R. (2005) Mol. Biol. Cell 16, 3353–3364 - PMC - PubMed
    1. Radhakrishnan Y., Maile L. A., Ling Y., Graves L. M., Clemmons D. R. (2008) J. Biol. Chem. 283, 16320–16331 - PMC - PubMed
    1. Myers M. G., Jr., Sun X. J., Cheatham B., Jachna B. R., Glasheen E. M., Backer J. M., White M. F. (1993) Endocrinology 132, 1421–1430 - PubMed
    1. Sun X. J., Rothenberg P., Kahn C. R., Backer J. M., Araki E., Wilden P. A., Cahill D. A., Goldstein B. J., White M. F. (1991) Nature 352, 73–77 - PubMed

Publication types

MeSH terms

LinkOut - more resources