. 2010 Apr 30;285(18):13781-7.
doi: 10.1074/jbc.M110.107300. Epub 2010 Mar 5.

RyR1-mediated Ca2+ leak and Ca2+ entry determine resting intracellular Ca2+ in skeletal myotubes

Affiliations

RyR1-mediated Ca2+ leak and Ca2+ entry determine resting intracellular Ca2+ in skeletal myotubes

José M Eltit et al. J Biol Chem. .

Abstract

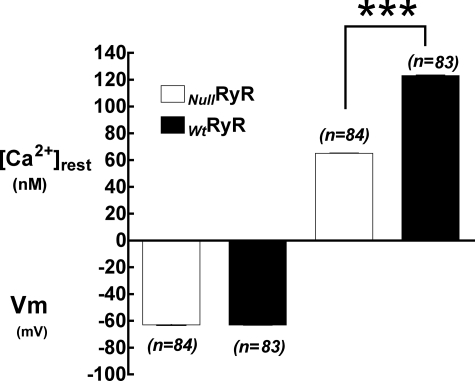
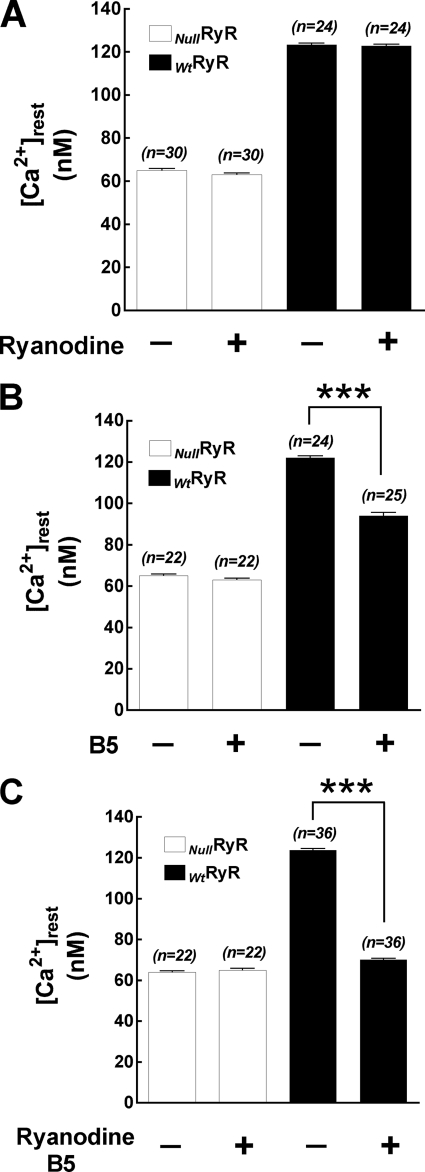
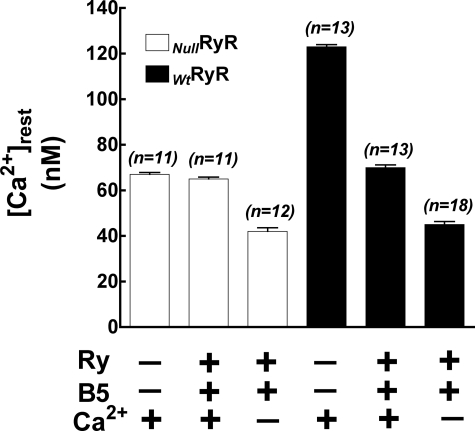
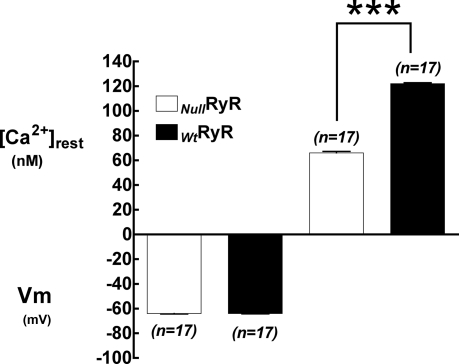
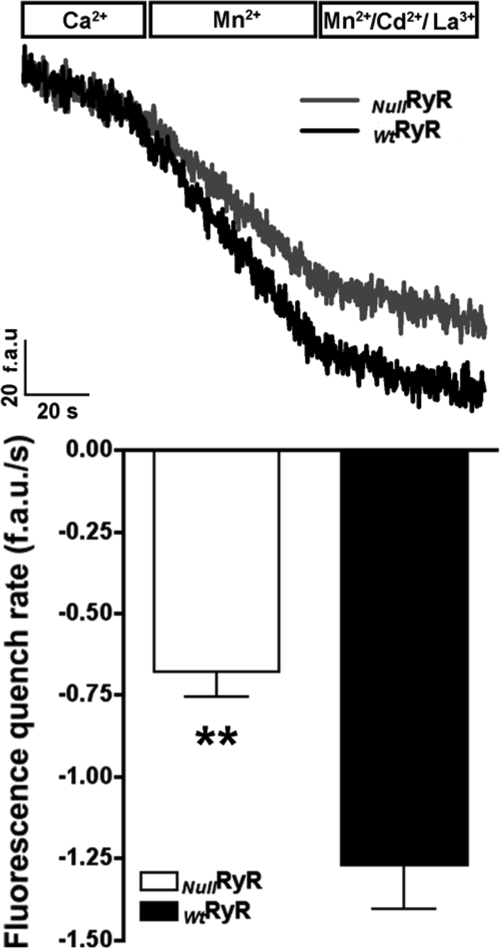
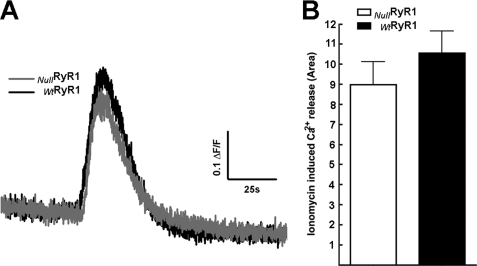
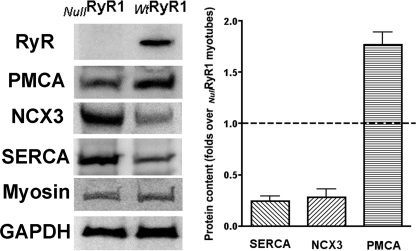
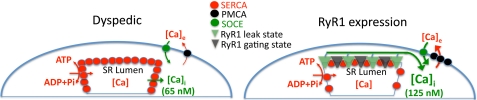
The control of resting free Ca(2+) in skeletal muscle is thought to be a balance of channels, pumps, and exchangers in both the sarcolemma and sarcoplasmic reticulum. We explored these mechanisms using pharmacologic and molecular perturbations of genetically engineered (dyspedic) muscle cells that constitutively lack expression of the skeletal muscle sarcoplasmic reticulum Ca(2+) release channels, RyR1 and RyR3. We demonstrate here that expression of RyR1 is responsible for more than half of total resting Ca(2+) concentration ([Ca(2+)](rest)) measured in wild type cells. The elevated [Ca(2+)](rest) in RyR1-expressing cells is not a result of active gating of the RyR1 channel but instead is accounted for by the RyR1 ryanodine-insensitive Ca(2+) leak conformation. In addition, we demonstrate that basal sarcolemmal Ca(2+) influx is also governed by RyR1 expression and contributes in the regulation of [Ca(2+)](rest) in skeletal myotubes.


Figures

FIGURE 1.
FIGURE 1.
Resting membrane potentials (left) and resting intracellular free Ca2+ concentrations (right) measured using double-barreled microelectrodes in RyR-null and Wt RyR1-expressing 1B5 myotubes. Data are expressed as mean ± S.D., n = 20 cells/group.
FIGURE 2.
FIGURE 2.
Resting intracellular free Ca2+ concentrations measured in RyR-null and Wt RyR1-expressing 1B5 myotubes. A, after treatment with 500 μm ryanodine. B, after treatment with 20 μm B5. C, after treatment with 500 μm ryanodine and 20 μm B5. Data are expressed as mean ± S.D., n = 20 cells/group.***, p < 0.0001.
FIGURE 3.
FIGURE 3.
Effects of removal of extracellular Ca2+ on intracellular free Ca2+ concentrations after pretreatment with ryanodine and B5. Data are expressed as mean ± S.D., n = 20 cells/group.
FIGURE 4.
FIGURE 4.
Resting membrane potentials (left) and resting intracellular free Ca2+ concentrations (right) measured using double-barreled microelectrodes in Wt and RyR-null primary myotubes. Data are expressed as mean ± S.D., n = 20 cells/group.
FIGURE 5.
FIGURE 5.
Measurements of resting cation entry using Mn2+ quench in RyR-null and Wt primary myotubes. Upper, fura-2 fluorescence raw traces from representative myotubes in the presence of extracellular Ca2+, Mn2+ in the absence of Ca2+, and Mn2+ in the absence of Ca2+ after the addition of extracellular Cd2+ and La3+. Lower, comparison of the rate of Mn2+ quench between Wt and RyR-null primary myotubes. Data are shown as mean ± S.D., n = 15 cells/group. **, p < 0.0001.
FIGURE 6.
FIGURE 6.
Fluo-5N fluorescence signals after the addition of 5 μm inomycin to Wt and RyR-null primary myotubes in the presence of nominal free extracellular Ca2+ buffer. A, representative curve of Wt and RyR-null responses. B, average area under the curve of the inomycin-induced Ca2+ release. Data are shown as mean ± S.D., n = 20 cells in each group. p > 0.05.
FIGURE 7.
FIGURE 7.
Expression of Ca2+-handling proteins in Wt and RyR-null primary myotubes. Left, representative Western blots using antibodies directed against RyR1, PMCA, NCX3, SERCA1, myosin (to demonstrate similar differentiation state), and glyceraldehyde-3-phosphate dehydrogenase (GAPDH) as a loading control. Right, expression of RyR1 associated with a significant decrease in the expression of SERCA and NCX3 and a significant up-regulation of the expression of PMCA. Data are expressed as mean ± S.D., n = 5 Western blots/group.
FIGURE 8.
FIGURE 8.
Model showing the changes in expression of Ca2+-handling proteins and the consequent changes in myoplasmic Ca2+ concentration, rate of resting Ca2+ entry, and Ca2+ removal.

Comment in

Similar articles

Cited by

References

    1. López J. R., Alamo L., Caputo C., DiPolo R., Vergara S. (1983) Biophys. J. 43, 1–4 - PMC - PubMed
    1. López J. R., Linares N., Pessah I. N., Allen P. D. (2005) Am. J. Physiol. Cell Physiol. 288, C606–C612 - PubMed
    1. López J. R., Medina P., Alamo L. (1987) Muscle Nerve 10, 77–79 - PubMed
    1. Yang T., Esteve E., Pessah I. N., Molinski T. F., Allen P. D., López J. R. (2007) Am. J. Physiol. Cell Physiol. 292, C1591–C1598 - PubMed
    1. Ward C. W., Protasi F., Castillo D., Wang Y., Chen S. R., Pessah I. N., Allen P. D., Schneider M. F. (2001) Biophys. J. 81, 3216–3230 - PMC - PubMed

Publication types

MeSH terms

Substances

LinkOut - more resources