

Defects in oxygen supply to skeletal muscle of prediabetic ZDF rats
- PMID: 20207810
- PMCID: PMC2886624
- DOI: 10.1152/ajpheart.01239.2009
Defects in oxygen supply to skeletal muscle of prediabetic ZDF rats
Abstract
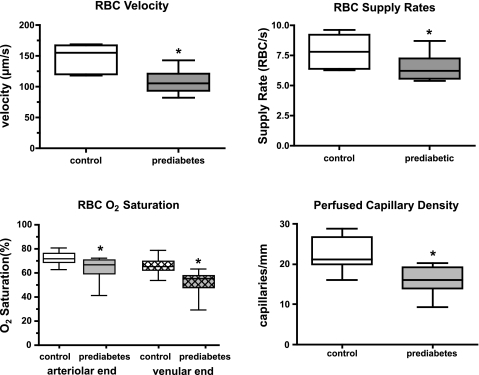
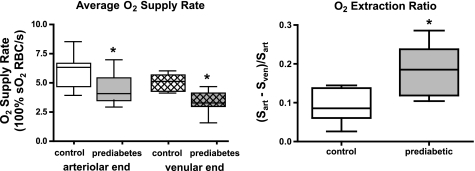
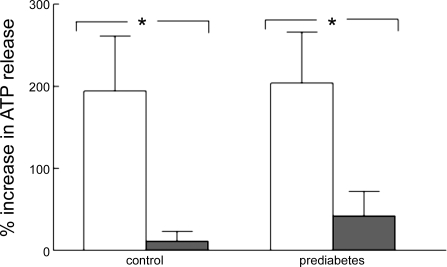
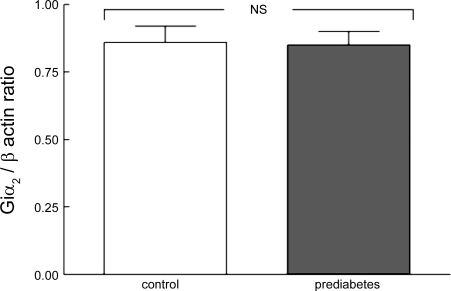
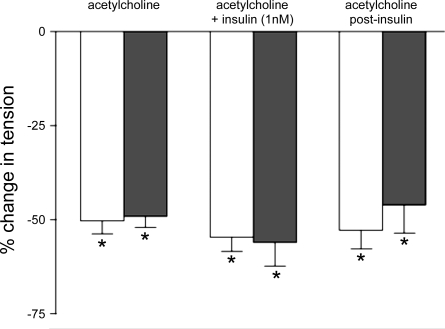
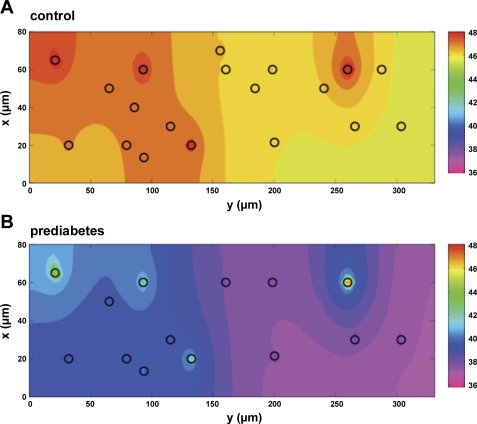
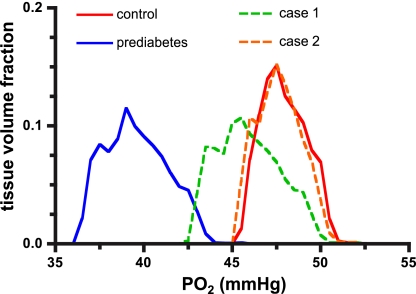
In humans, prediabetes is characterized by marked increases in plasma insulin and near normal blood glucose levels as well as microvascular dysfunction of unknown origin. Using the extensor digitorum longus muscle of 7-wk inbred male Zucker diabetic fatty rats fed a high-fat diet as a model of prediabetes, we tested the hypothesis that hyperinsulinemia contributes to impaired O(2) delivery in skeletal muscle. Using in vivo video microscopy, we determined that the total O(2) supply to capillaries in the extensor digitorum longus muscle of prediabetic rats was reduced to 64% of controls with a lower O(2) supply rate per capillary and higher O(2) extraction resulting in a decreased O(2) saturation at the venous end of the capillary network. These findings suggest a lower average tissue Po(2) in prediabetic animals. In addition, we determined that insulin, at concentrations measured in humans and Zucker diabetic fatty rats with prediabetes, inhibited the O(2)-dependent release of ATP from rat red blood cells (RBCs). This inability to release ATP could contribute to the impaired O(2) delivery observed in rats with prediabetes, especially in light of the finding that the endothelium-dependent relaxation of resistance arteries from these animals is not different from controls and is not altered by insulin. Computational modeling confirmed a significant 8.3-mmHg decrease in average tissue Po(2) as well as an increase in the heterogeneity of tissue Po(2), implicating a failure of a regulatory system for O(2) supply. The finding that insulin attenuates the O(2)-dependent release of ATP from RBCs suggests that this defect in RBC physiology could contribute to a failure in the regulation of O(2) supply to meet the demand in skeletal muscle in prediabetes.
Figures
Comment in
-
Erythrocytes: surveyors as well as purveyors of oxygen?Am J Physiol Heart Circ Physiol. 2010 Jun;298(6):H1637-8. doi: 10.1152/ajpheart.00285.2010. Epub 2010 Mar 26. Am J Physiol Heart Circ Physiol. 2010. PMID: 20348227 No abstract available.
References
-
- Ardigo D, Franzini L, Valtuena S, Monti LD, Reaven GM, Zavaroni I. Relation of plasma insulin levels to forearm flow-mediated dilatation in healthy volunteers. Am J Cardiol 97: 1250–1254, 2006 - PubMed
-
- Benjamin SM, Valdez R, Geiss LS, Rolka DB, Narayan KM. Estimated number of adults with prediabetes in the US in 2000: opportunities for prevention. Diabetes Care 26: 645–649, 2003 - PubMed
-
- Bock G, Dalla Man C, Campioni M, Chittilapilly E, Basu R, Toffolo G, Cobelli C, Rizza R. Pathogenesis of pre-diabetes: mechanisms of fasting and postprandial hyperglycemia in people with impaired fasting glucose and/or impaired glucose tolerance. Diabetes 55: 3536–3549, 2006 - PubMed
-
- Clement K, Vaisse C, Lahlou N, Cabrol S, Pelloux V, Cassuto D, Gourmelen M, Dina C, Chambaz J, Lacorte JM, Basdevant A, Bougneres P, Lebouc Y, Froguel P, Guy-Grand B. A mutation in the human leptin receptor gene causes obesity and pituitary dysfunction. Nature 392: 398–401, 1998 - PubMed
-
- Corsetti JP, Sparks JD, Peterson RG, Smith RL, Sparks CE. Effect of dietary fat on the development of non-insulin dependent diabetes mellitus in obese Zucker diabetic fatty male and female rats. Atherosclerosis 148: 231–241, 2000 - PubMed
Publication types
MeSH terms
Substances
Grants and funding
LinkOut - more resources
Full Text Sources
Medical