. 2010 Jul;24(7):2405-16.
doi: 10.1096/fj.09-149898. Epub 2010 Mar 5.

Forward operation of adenine nucleotide translocase during F0F1-ATPase reversal: critical role of matrix substrate-level phosphorylation

Affiliations

Forward operation of adenine nucleotide translocase during F0F1-ATPase reversal: critical role of matrix substrate-level phosphorylation

Christos Chinopoulos et al. FASEB J. 2010 Jul.

Abstract

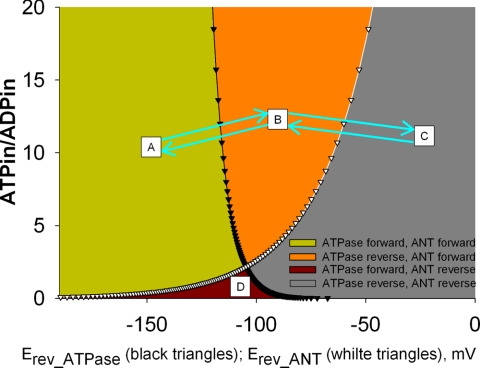
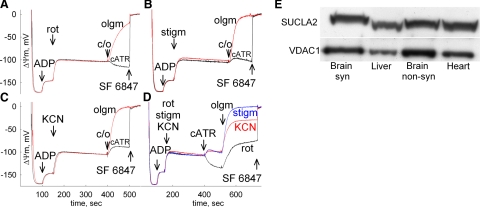
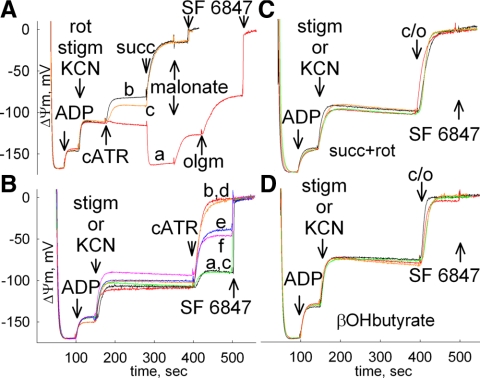
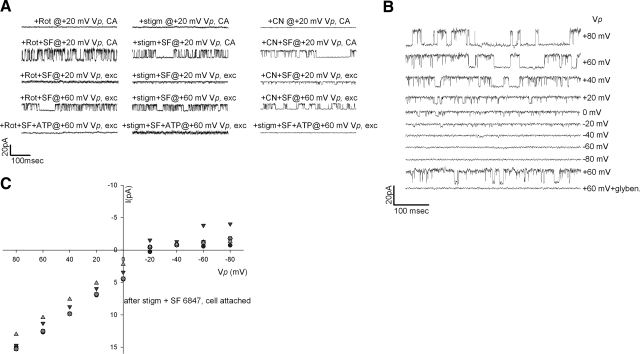
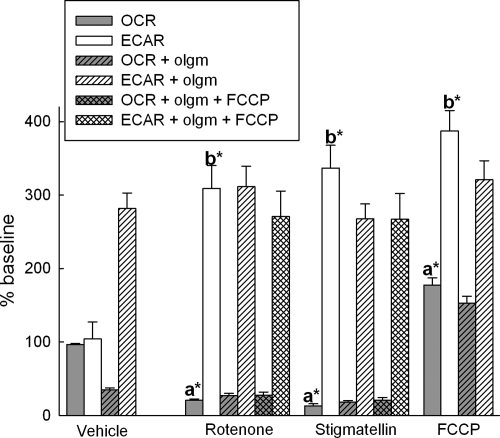
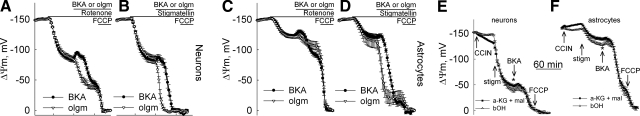
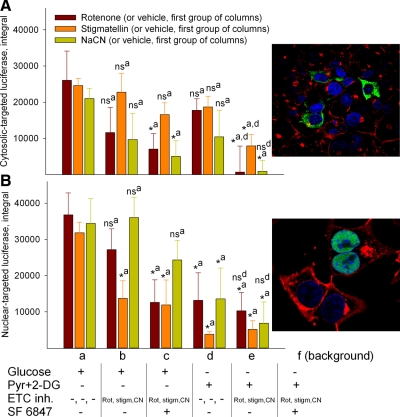
In pathological conditions, F(0)F(1)-ATPase hydrolyzes ATP in an attempt to maintain mitochondrial membrane potential. Using thermodynamic assumptions and computer modeling, we established that mitochondrial membrane potential can be more negative than the reversal potential of the adenine nucleotide translocase (ANT) but more positive than that of the F(0)F(1)-ATPase. Experiments on isolated mitochondria demonstrated that, when the electron transport chain is compromised, the F(0)F(1)-ATPase reverses, and the membrane potential is maintained as long as matrix substrate-level phosphorylation is functional, without a concomitant reversal of the ANT. Consistently, no cytosolic ATP consumption was observed using plasmalemmal K(ATP) channels as cytosolic ATP biosensors in cultured neurons, in which their in situ mitochondria were compromised by respiratory chain inhibitors. This finding was further corroborated by quantitative measurements of mitochondrial membrane potential, oxygen consumption, and extracellular acidification rates, indicating nonreversal of ANT of compromised in situ neuronal and astrocytic mitochondria; and by bioluminescence ATP measurements in COS-7 cells transfected with cytosolic- or nuclear-targeted luciferases and treated with mitochondrial respiratory chain inhibitors in the presence of glycolytic plus mitochondrial vs. only mitochondrial substrates. Our findings imply the possibility of a rescue mechanism that is protecting against cytosolic/nuclear ATP depletion under pathological conditions involving impaired respiration. This mechanism comes into play when mitochondria respire on substrates that support matrix substrate-level phosphorylation.


Figures

Figure 1.
Figure 1.
Computational estimation of Erev_ANT and Erev_ATPase at different free [ATP]in/[ADP]in ratios. A: ATPase forward, ANT forward; B: ATP reverse, ANT forward; C: ATPase reverse, ANT reverse; D: ATPase forward, ANT reverse. Black triangles represent Erev_ATPase; white triangles represent Erev_ANT. Values were computed for [ATP]out = 1.2 mM, [ADP]out = 10 μM, Pin = 0.02 M, n = 3.9, pHi = 7.38, and pHo = 7.25.
Figure 2.
Figure 2.
A–D) Effect of cATR or oligomycin (olgm) on ΔΨm in rat liver mitochondria compromised at complex I, III, or IV with rotenone (rot, A, D), stigmatellin (stigm, B, D), or KCN (C, D), respectively. c/o indicates additions of cATR or oligomycin. Panel D shows the effect of oligomycin added after cATR. For each panel, mitochondria were allowed to be fully charged by glutamate plus malate, and state 3 respiration was induced by 1 mM ADP before addition of the respiratory chain inhibitors. At the end of experiments, 200 nM SF 6847 was added to achieve complete depolarization. E) Western blot of rat brain synaptic (syn), liver, brain nonsynaptic, and heart mitochondria for SUCLA2 and VDAC-1.
Figure 3.
Figure 3.
Effect of cATR or oligomycin (olgm) on ΔΨm of mitochondria compromised at complex I, III, or IV in the presence of different substrate combinations. A) 1 mM ADP was given where indicated to mitochondria polarized by glutamate plus malate, and, subsequently, complex I, III, or IV was compromised by rotenone (rot, trace a), stigmatellin (stigm, trace c), or KCN (trace b), respectively; cATR was added where indicated. Subsequently, succinate (succ, 5 mM) was administered, followed by malonate (10 mM), where indicated. In trace a, oligomycin was also added after malonate. B) Mitochondria were allowed to be fully charged in the presence of the following substrate combinations: glutamate plus malate (traces a and c), glutamate plus malate plus succinate plus malonate (traces b and d), or glutamate plus malate plus propionate (traces e and f). Stigmatellin was given for traces a, e, and b; KCN was given in lieu of stigmatellin for traces c, f, and d. C, D) Mitochondria were polarized by succinate plus rotenone (C) or β-OH butyrate (D). ADP (1 mM) was given where indicated; subsequently, complex III or IV was compromised by stigmatellin or KCN, respectively; cATR or oligomycin was added where indicated (c/o). At the end of all experiments, 200 nM SF 6847 was added to achieve complete depolarization.
Figure 4.
Figure 4.
Single-channel recordings in the cell-attached or excised inside-out patch mode of cultured cortical neurons, challenged by ETC inhibitors. A) Single-channel recordings in the presence of rotenone (rot), stigmatellin (stigm), or NaCN (CN) with or without SF 6847 (SF) in the presence of 0.25 mM iodoacetamide and 0.1 mM pinacidil, among other plasma membrane channel inhibitors, as described in Materials and Methods. Vp, pipette potential; CA, cell-attached; exc, excised. B) Single-channel recordings in the −80- to +80-mV pipette potential range; glyben, glibenclamide. C) Current-voltage relationship of the unitary conductance of channels appearing after application of stigmatellin and SF 6847 in the cell-attached mode.
Figure 5.
Figure 5.
Effect of rotenone or stigmatellin on oxygen consumption and extracellular acidification rates in rat cortical cultures with or without oligomycin (olgm). OCR and ECAR were determined in a microplate format respirometry/pH assay. Solid bars indicate mean ± se of OCR (gray) and ECAR (white), normalized to resting conditions, after mixing of vehicle, rotenone (2 μM), stigmatellin (1.2 μM), or FCCP (1 μM) to the assay medium. Hatched bars indicate the above conditions in the presence of oligomycin (2 μg/ml) and cross-hatched bars after addition of FCCP (1 μM). Data are from 4 independent cell culture preparations; n =10–12 wells/condition. *P < 0.05 vs. vehicle for OCR (a) or ECAR (b); ANOVA with Tukey’s post hoc test.
Figure 6.
Figure 6.
Effect of BKA, oligomycin (olgm), and a metabolic condition not supporting succinate thiokinase reaction on the rotenone- or stigmatellin-evoked depolarization of ΔΨm in cultured rat cortical neurons (A, B, E) and astrocytes (C, D, F). ΔΨm was followed in intact cells with fluorescence microscopy using the potentiometric probes PMPI and TMRM. ΔΨm (mV) was calculated by a compartment model-based, dynamic calibration of single-cell fluorescence intensities (see Supplemental Material). A–D) BKA (50 μM; •), oligomycin (2 μg/ml; ▿), rotenone (2 μM), stigmatellin (1.2 μM), and FCCP (1 μM) were added by mixing into the assay medium containing 15 mM glucose and were present as indicated by bars. E, F) CCIN (500 μM) was added together with (R)-β-OH-butyrate (5 mM; ▪) or with α-ketoglutarate plus l-malate (both 5 mM; ▵) in the presence of 5 mM glucose, as marked (CCIN). Following additions were performed as described above. *P < 0.05; Student’s t test. Data were pooled from 3 to 5 independent cell culture preparations; data points represent the means ± se of n = 6–9 view fields containing 200–300 neurons or 80–150 astrocytes per condition.
Figure 7.
Figure 7.
Integrals of luciferin/luciferase-assisted ATP luminescence in COS-7 cells during various metabolic conditions, transfected with cytosolic- or nuclear-targeted luciferases. A) Integral of cytosol-targeted firefly luciferase luminescence signal for various metabolic conditions, as shown at bottom (a–e). Glucose (15 mM); Pyr, pyruvate (5 mM); 2-DG, 2-deoxyglucose (2 mM); ETC inh, ETC inhibitor. B) Same as in A, but for nuclear-targeted luciferase. For background subtraction, the following metabolic condition (f) was used in both panels: no glucose + SF 6847 + ETC inhibitor + pyruvate + 2-deoxyglucose. Data were pooled from 3 independent cell culture preparations. *P < 0.05 vs. vehicle; ANOVA with Tukey’s post hoc test compared with the vehicle treatment. a, glucose only; d, Pyr + 2DG only; ns, nonsignificant. Insets: confocal micrographs (0.65-μm z sections) of luciferase targeted to the cytosol (top) or to the nucleus (bottom), stained by Alexa 647 agglutinin (before permeabilization) that decorates the plasma membrane and the Golgi apparatus (red), DAPI for the nucleus (blue), and antibodies raised against the luciferase (green).

Similar articles

Cited by

References

    1. Rouslin W, Erickson J L, Solaro R J. Effects of oligomycin and acidosis on rates of ATP depletion in ischemic heart muscle. Am J Physiol. 1986;250:H503–H508. - PubMed
    1. McMillin J B, Pauly D F. Control of mitochondrial respiration in muscle. Mol Cell Biochem. 1988;81:121–129. - PubMed
    1. Petronilli V, Azzone G F, Pietrobon D. Analysis of mechanisms of free-energy coupling and uncoupling by inhibitor titrations: theory, computer modeling and experiments. Biochim Biophys Acta. 1988;932:306–324. - PubMed
    1. Rouslin W, Broge C W, Grupp I L. ATP depletion and mitochondrial functional loss during ischemia in slow and fast heart-rate hearts. Am J Physiol. 1990;259:H1759–H1766. - PubMed
    1. Wisniewski E, Kunz W S, Gellerich F N. Phosphate affects the distribution of flux control among the enzymes of oxidative phosphorylation in rat skeletal muscle mitochondria. J Biol Chem. 1993;268:9343–9346. - PubMed

Publication types

Substances

LinkOut - more resources