. 2010 Apr 15;184(8):4391-400.
doi: 10.4049/jimmunol.0903918. Epub 2010 Mar 5.

Regulatory T cells inhibit T cell proliferation and decrease demyelination in mice chronically infected with a coronavirus

Affiliations

Regulatory T cells inhibit T cell proliferation and decrease demyelination in mice chronically infected with a coronavirus

Kathryn Trandem et al. J Immunol. .

Abstract

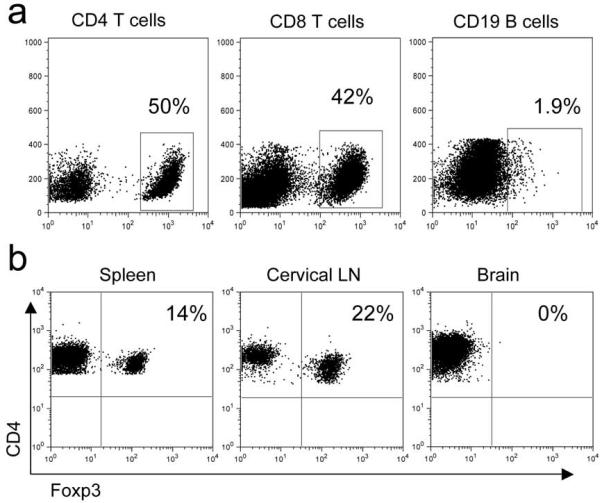
Mice infected with the neurotropic JHM strain of mouse hepatitis virus (JHMV) develop acute and chronic demyelinating diseases with histopathological similarities to multiple sclerosis. The process of demyelination is largely immune-mediated, as immunodeficient mice (RAG1(-/-) mice) do not develop demyelination upon infection; however, demyelination develops if these mice are reconstituted with either JHMV-immune CD4 or CD8 T cells. Because myelin destruction is a consequence of the inflammatory response associated with virus clearance, we reasoned that decreasing the amount of inflammation would diminish clinical disease and demyelination. Given that regulatory T cells (Tregs) have potent anti-inflammatory effects, we adoptively transferred Tregs into infected C57BL/6 and RAG1(-/-) mice. In both instances, transfer of Tregs decreased weight loss, clinical scores, and demyelination. Transferred Tregs were not detected in the CNS of infected RAG1(-/-) mice, but rather appeared to mediate their effects in the draining cervical lymph nodes. We show that Tregs dampen the inflammatory response mediated by transferred JHMV-immune splenocytes in infected RAG1(-/-) mice by decreasing T cell proliferation, dendritic cell activation, and proinflammatory cytokine/chemokine production, without inducing apoptosis. By extension, decreasing inflammation, whether by Treg transfer or by otherwise enhancing the anti-inflammatory milieu, could contribute to improved clinical outcomes in patients with virus-induced demyelination.


Figures

Figure 1
Figure 1. Transferred Tregs ameliorated disease in J2.2-V-1-infected B6 mice with demyelinating encephalomyelitis
B6 mice were infected with 1000 PFU J2.2-V-1 and received 4×10⁵ CD4+Foxp3+ or 4×10⁵ CD4+Foxp3 naïve splenocytes at day 5 p.i. Mice were weighed daily (a), and monitored for survival (b) and clinical disease (c). Scoring was as described in Materials and Methods. Data are from three independent experiments with at least 16 mice/group. Statistically significant differences in weight (a, days 9-21, P < 0.05) and clinical disease (c, days 8-12, P < 0.05) were detected.
Figure 2
Figure 2. Transferred Tregs reduced demyelination without affecting virus clearance in J2.2-V-1-infected B6 mice
(a,b) Luxol fast blue staining of spinal cords at day 21 p.i. from B6 mouse receiving CD4+Foxp3+ (a) or CD4+Foxp3 (b) splenocytes at day 5 p.i. Less demyelination was detected in the spinal cords of mice that received CD4+Foxp3+ cells. Demyelinated areas are outlined in yellow. (c) Percent demyelination from individual mice at day 21 p.i. Numbers are % demyelination ± s.e.m. A statistically significant difference in demyelination was observed (*, P < 0.05). (d) Viral titers from J2.2-V-1-infected B6 mice at days 9 and 14 p.i. The dashed line represents the limit of detection. Data are from two independent experiments with ≥ 6 mice/group.
Figure 3
Figure 3. Transferred Tregs reduced inflammatory infiltration into the J2.2-V-1-infected CNS
(a-d) Total CD4 and CD8 T cell numbers and percentage of T cells isolated from the brain at day 9 p.i. (a, b) and 21 p.i. (c,d) *, P < 0.05; **, P < 0.01; N.S., not significant. Data are from three independent experiments. (e) FACS data from CNS-derived lymphocytes directly stimulated with peptide ex vivo or stained for tetramer at day 14 p.i. Cells are gated on CD8+ or CD4+ T cells. Frequency and number of epitope-specific T cells are shown. Four mice were analyzed per group. Data are from one experiment representative of two.
Figure 4
Figure 4. RAG1−/− mice receiving transferred Tregs showed improved clinical outcomes with delayed virus clearance and decreased demyelination
RAG1−/− mice were infected with 500 PFU J2.2-V-1 and received 1×10⁶ JHMV-immune B6 splenocytes and 4×10⁵ CD4+Foxp3+ or 4×10⁵ CD4+Foxp3 naïve splenocytes or no cells at day 4 p.i. Weight (a) and clinical scores (b) were monitored. Differences in weight and clinical scores between mice that received CD4+Foxp3+ and CD4+Foxp3 reached statistical significance at days 6-14 (P < 0.05) and days 8-14 (P < 0.05), respectively. (c) Virus titers from J2.2-V-1 infected RAG1−/− mice at days 10 and 14 p.i. (d) Luxol fast blue stained spinal cords were examined for demyelination at day 14 p.i. A statistically significant difference in demyelination was observed. Each symbol represents an individual mouse. *, P < 0.05; **, P < 0.01; ***, P < 0.001; N.S., not significant; N.D., not determined. Data are from three (a,b) or two (c,d) independent experiments with at least 6 mice/group.
Figure 5
Figure 5. Transferred effector T cells but not Tregs reconstituted the brains of infected RAG1−/− mice
(a) RAG1−/− mice were infected with 500 PFU J2.2-V-1 and received 4×10⁵ CD4+Foxp3+ T cells and 1×10⁶ JHMV-immune B6 splenocytes at day 4 p.i. Mice were sacrificed at day 14 p.i. and analyzed for CD4 and CD8 T and B cells in the brain. Gated cells are labeled above plots with percentages shown from gates. (b) Flow cytometry of Tregs isolated from RAG1−/− mice as described in (a). Cells are gated on CD4+ T cells isolated from indicated site. Numbers are percentage of cells in right upper quadrant. Data are from one experiment representative of three independent experiments.
Figure 6
Figure 6. Treg transfer diminished the numbers of CD4 and CD8 T cells in the CLN and brains of J2.2-V-1-infected RAG1−/− mice
RAG1−/− mice were infected with 500 PFU J2.2-V-1 and received 1×10⁶ JHMV-immune B6 splenocytes and 4×10⁵ CD4+Foxp3+ (filled bars) or 4×10⁵ CD4+Foxp3 (open bars) cells at day 4 p.i. Mice were sacrificed at day 10 p.i. (a,b,e,g) or day 14 p.i. (c,d,f,h). Numbers and percentages of T cells in the brain (a-d), CLN (e,f) and spleen (g,h) are shown. Numbers of Tregs were below the level of detection in the brain at day 10 p.i. *, P < 0.05; **, P < 0.01; ***, P < 0.001; N.S., not significant. Data are from three independent experiments with at least 9 mice/group.
Figure 7
Figure 7. Transferred Tregs did not change percentage of virus-specific T cells in the CNS of J2.2-V-1-infected RAG1−/− mice
RAG1−/− mice were infected with 500 PFU J2.2-V-1 and received 1×10⁶ JHMV-immune B6 splenocytes and 4×10⁵ CD4+Foxp3+ or 4×10⁵ CD4+Foxp3 cells at day 4 p.i. Mice were sacrificed at day 10 p.i. and flow cytometric analyses were performed on CNS-derived lymphocytes stimulated with virus-specific peptide directly ex vivo or stained with tetramer. Cells are gated on CD8+ or CD4+ T cells. Numbers are percentage of cells in right upper quadrant. Data are from one experiment representative of two independent experiments with 6 mice/group.
Figure 8
Figure 8. Transferred Tregs suppressed T cell proliferation but did not enhance level of apoptosis
RAG1−/− mice were infected with 500 PFU J2.2-V-1 and received 1×10⁶ JHMV-immune B6 splenocytes and 4×10⁵ CD4+Foxp3+ (filled bars) or 4×10⁵ CD4+Foxp3 (open bars) cells at day 4 p.i. (a,b) BrdU was administered to mice intraperitoneally as described in Materials and Methods at 10 day p.i. The percentage of brain (a) and CLN-derived (b) cells that incorporated BrdU incorporation after 16 hours in vivo labeling is shown. (c,d) Mice were sacrificed at day 10 p.i. and analyzed for percentage of brain (c) or CLN-derived (d) cells that expressed active caspase 3 and 7. *, P < 0.05; **, P < 0.01; N.S., not significant. Data are from two independent experiments with ≥ 6 mice/group.
Figure 9
Figure 9. Transferred Tregs suppressed DC activation and production of pro-inflammatory cytokines and chemokines in brains and CLN of J2.2-V-1-infected RAG1−/− mice
RAG1−/− mice were infected with 500 PFU J2.2-V-1 and received 1×10⁶ JHMV-immune B6 splenocytes and 4×10⁵ CD4+Foxp3+ (filled bars) or 4×10⁵ CD4+Foxp3 (open bars) cells at day 4 p.i. Mice were sacrificed at day 10 p.i. (a,b) CLN cells were examined for CD40, CD80, CD86 and MHC class II expression. DC gating strategy is shown in left hand panel. Middle and right hand panels show representative histograms of CD86 and CD40 staining (isotype control-filled; recipients of CD4+Foxp3+ cells-light line; recipients of CD4+Foxp3 cells-bold line). (c,d) Levels of the indicated cytokines and chemokines in the brain and CLN were measured by qRT-PCR or ELISA as described in Materials and Methods. *, P < 0.05; **, P < 0.01; N.S., not significant. Data are from 5-15 mice/group.

References

    1. Hori S, Nomura T, Sakaguchi S. Control of regulatory T cell development by the transcription factor Foxp3. Science. 2003;299:1057–1061. - PubMed
    1. Feuerer M, Hill JA, Mathis D, Benoist C. Foxp3+ regulatory T cells: differentiation, specification, subphenotypes. Nat Immunol. 2009;10:689–695. - PubMed
    1. Shevach EM. From vanilla to 28 flavors: multiple varieties of T regulatory cells. Immunity. 2006;25:195–201. - PubMed
    1. Li S, Gowans EJ, Chougnet C, Plebanski M, Dittmer U. Natural regulatory T cells and persistent viral infection. J Virol. 2008;82:21–30. - PMC - PubMed
    1. Robertson SJ, Messer RJ, Carmody AB, Hasenkrug KJ. In vitro suppression of CD8+ T cell function by Friend virus-induced regulatory T cells. J Immunol. 2006;176:3342–3349. - PubMed

Publication types

MeSH terms

Substances