

Modeling the lag period and exponential growth of Listeria monocytogenes under conditions of fluctuating temperature and water activity values
- PMID: 20208022
- PMCID: PMC2863444
- DOI: 10.1128/AEM.02572-09
Modeling the lag period and exponential growth of Listeria monocytogenes under conditions of fluctuating temperature and water activity values
Abstract
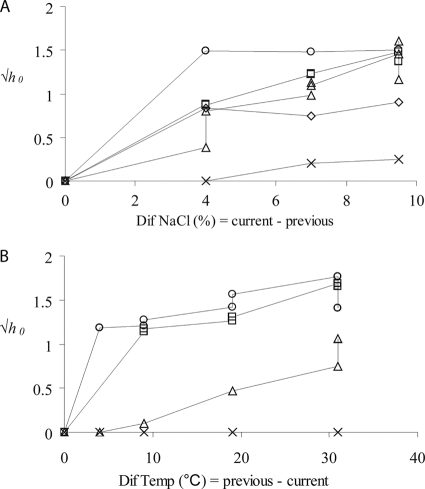
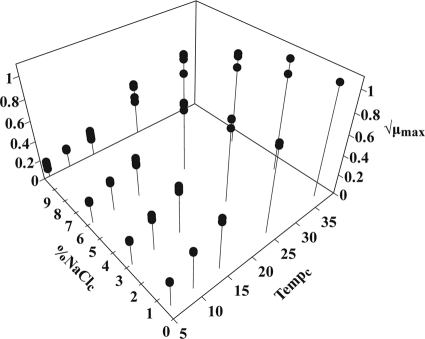
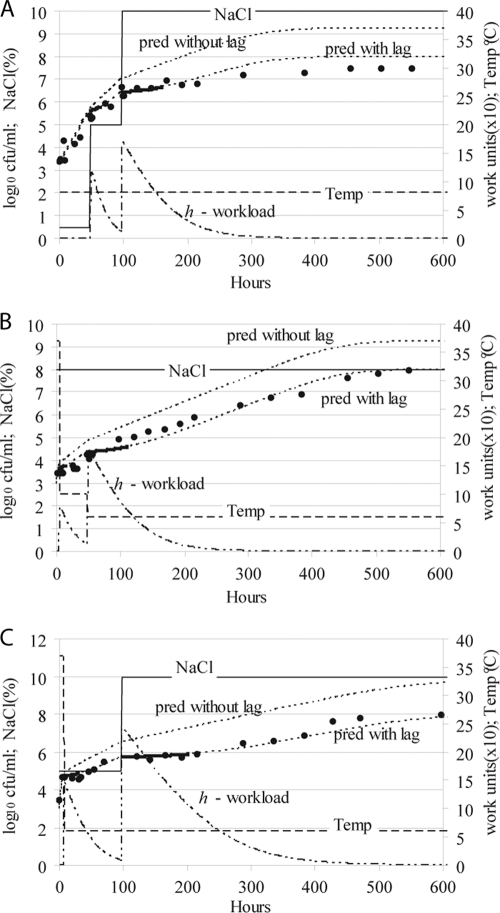
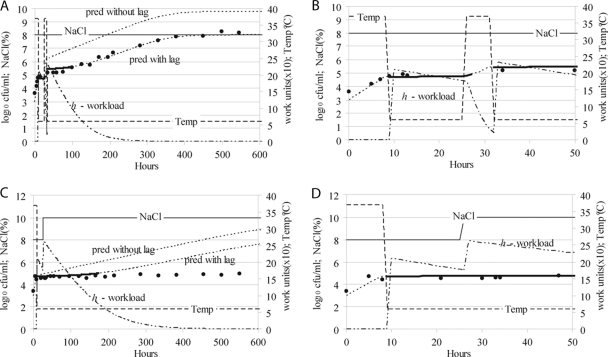
The dynamic model for the growth of a bacterial population described by Baranyi and Roberts (J. Baranyi and T. A. Roberts, Int. J. Food Microbiol. 23:277-294, 1994) was applied to model the lag period and exponential growth of Listeria monocytogenes under conditions of fluctuating temperature and water activity (a(w)) values. To model the duration of the lag phase, the dependence of the parameter h(0), which quantifies the amount of work done during the lag period, on the previous and current environmental conditions was determined experimentally. This parameter depended not only on the magnitude of the change between the previous and current environmental conditions but also on the current growth conditions. In an exponentially growing population, any change in the environment requiring a certain amount of work to adapt to the new conditions initiated a lag period that lasted until that work was finished. Observations for several scenarios in which exponential growth was halted by a sudden change in the temperature and/or a(w) were in good agreement with predictions. When a population already in a lag period was subjected to environmental fluctuations, the system was reset with a new lag phase. The work to be done during the new lag phase was estimated to be the workload due to the environmental change plus the unfinished workload from the uncompleted previous lag phase.
Figures
Similar articles
-
Effect of environmental parameters (temperature, pH and a(w)) on the individual cell lag phase and generation time of Listeria monocytogenes.Int J Food Microbiol. 2006 May 1;108(3):326-35. doi: 10.1016/j.ijfoodmicro.2005.11.017. Epub 2006 Feb 20. Int J Food Microbiol. 2006. PMID: 16488043
-
Measurements and predictions of growth for Listeria monocytogenes and Salmonella during fluctuating temperature II. Rapidly changing temperatures.Int J Food Microbiol. 2001 Jul 20;67(1-2):131-7. doi: 10.1016/s0168-1605(01)00446-9. Int J Food Microbiol. 2001. PMID: 11482561
-
A model describing the relationship between regrowth lag time and mild temperature increase for Listeria monocytogenes.Int J Food Microbiol. 1999 Feb 18;46(3):251-61. doi: 10.1016/s0168-1605(98)00200-1. Int J Food Microbiol. 1999. PMID: 10100905
-
Cell division theory and individual-based modeling of microbial lag: part I. The theory of cell division.Int J Food Microbiol. 2005 Jun 15;101(3):303-18. doi: 10.1016/j.ijfoodmicro.2004.11.016. Int J Food Microbiol. 2005. PMID: 15925713 Review.
-
Predictive modelling of the microbial lag phase: a review.Int J Food Microbiol. 2004 Jul 15;94(2):137-59. doi: 10.1016/j.ijfoodmicro.2004.01.006. Int J Food Microbiol. 2004. PMID: 15193801 Review.
Cited by
-
Modeling the effect of abrupt acid and osmotic shifts within the growth region and across growth boundaries on adaptation and growth of Listeria monocytogenes.Appl Environ Microbiol. 2010 Oct;76(19):6555-63. doi: 10.1128/AEM.00847-10. Epub 2010 Jul 30. Appl Environ Microbiol. 2010. PMID: 20675449 Free PMC article.
-
Establishing equivalence for microbial-growth-inhibitory effects ("iso-hurdle rules") by analyzing disparate listeria monocytogenes data with a gamma-type predictive model.Appl Environ Microbiol. 2012 Feb;78(4):1069-80. doi: 10.1128/AEM.06691-11. Epub 2011 Dec 9. Appl Environ Microbiol. 2012. PMID: 22156426 Free PMC article.
-
Modeling physiological processes that relate toxicant exposure and bacterial population dynamics.PLoS One. 2012;7(2):e26955. doi: 10.1371/journal.pone.0026955. Epub 2012 Feb 6. PLoS One. 2012. PMID: 22328915 Free PMC article.
-
The transcriptional heat shock response of Salmonella typhimurium shows hysteresis and heated cells show increased resistance to heat and acid stress.PLoS One. 2012;7(12):e51196. doi: 10.1371/journal.pone.0051196. Epub 2012 Dec 7. PLoS One. 2012. PMID: 23236453 Free PMC article.
-
Dynamic energy budget approach to modeling mechanisms of CdSe quantum dot toxicity.Ecotoxicology. 2013 Mar;22(2):319-30. doi: 10.1007/s10646-012-1028-7. Epub 2013 Jan 6. Ecotoxicology. 2013. PMID: 23291788
References
-
- Augustin, J. C., L. Rosso, and V. Carlier. 2000. A model describing the effect of temperature history on lag time for Listeria monocytogenes. Int. J. Food Microbiol. 57:169-181. - PubMed
-
- Baranyi, J., and C. Pin. 2001. Modelling microbial safety, p. 383-400. In L. M. M. Tijskens, M. L. A. T. M. Hertog, and B. M. Nicolai (ed.), Food process modelling. Woodhead Publishing Limited, Cambridge, England.
-
- Baranyi, J., and T. A. Roberts. 1994. A dynamic approach to predicting bacterial growth in food. Int. J. Food Microbiol. 23:277-294. - PubMed
-
- Baranyi, J., T. A. Roberts, and P. J. McClure. 1993. A non-autonomous differential equation to model bacterial growth. Food Microbiol. 10:43-59.
-
- Baranyi, J., T. P. Robinson, A. Kaloti, and B. M. Mackey. 1995. Predicting growth of Brochothrix thermosphacta at changing temperature. Int. J. Food Microbiol. 27:61-75. - PubMed
Publication types
MeSH terms
Substances
Grants and funding
LinkOut - more resources
Full Text Sources
