

Multimodal CARS microscopy determination of the impact of diet on macrophage infiltration and lipid accumulation on plaque formation in ApoE-deficient mice
- PMID: 20208058
- PMCID: PMC2882730
- DOI: 10.1194/jlr.M003616
Multimodal CARS microscopy determination of the impact of diet on macrophage infiltration and lipid accumulation on plaque formation in ApoE-deficient mice
Abstract
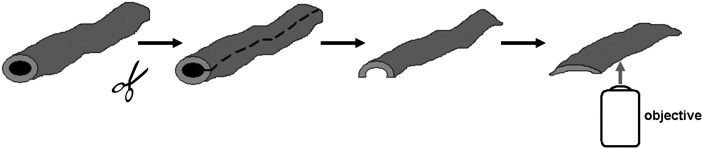
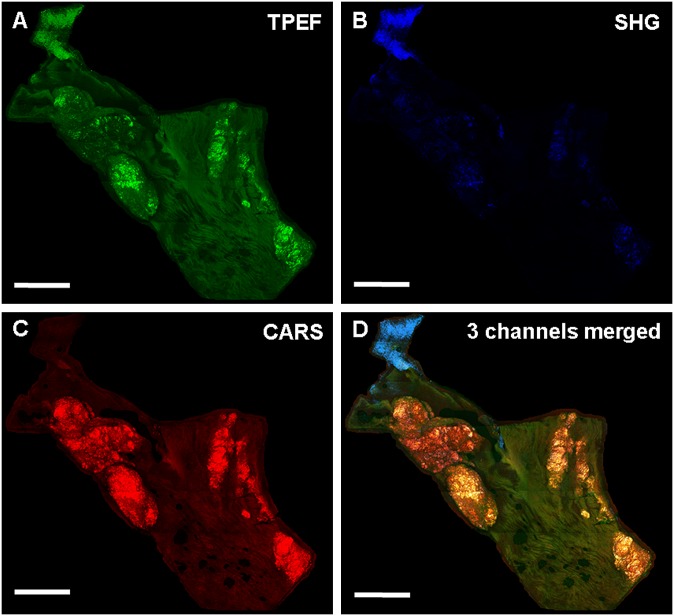
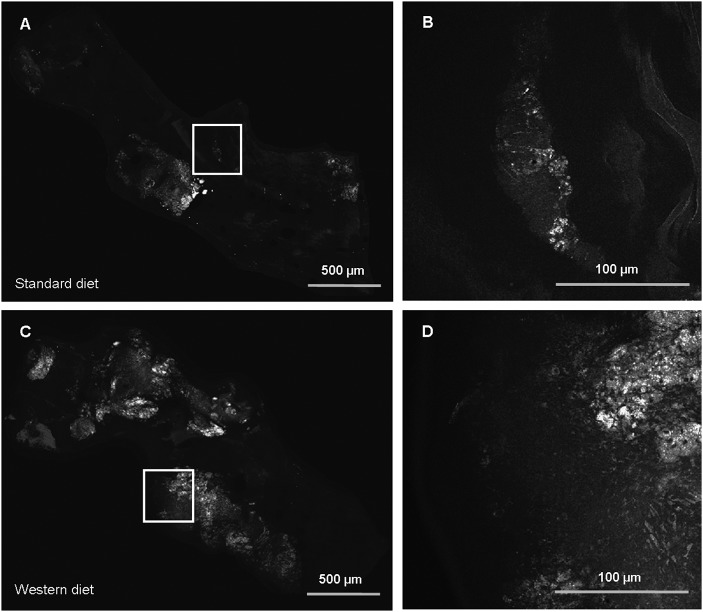
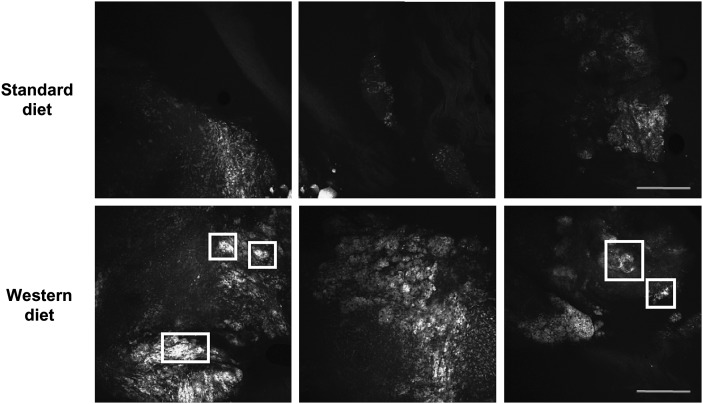
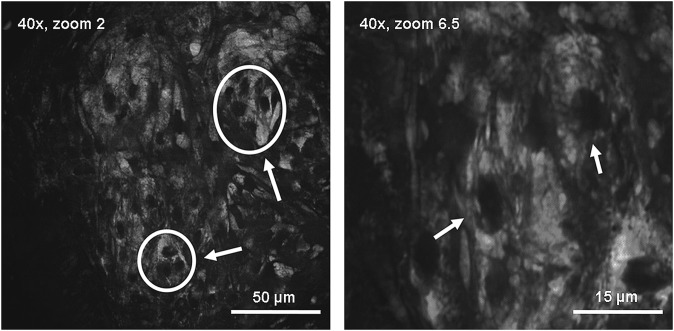
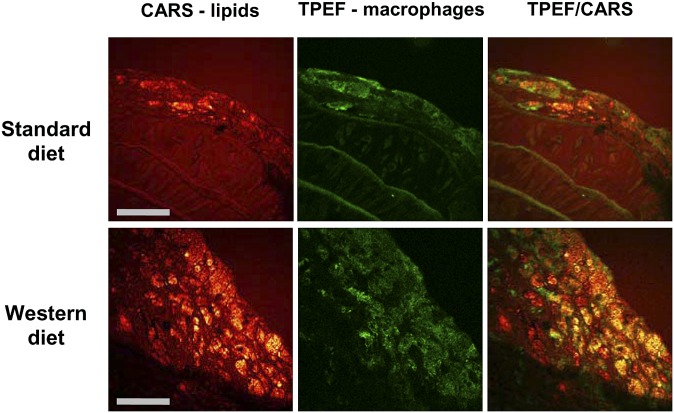
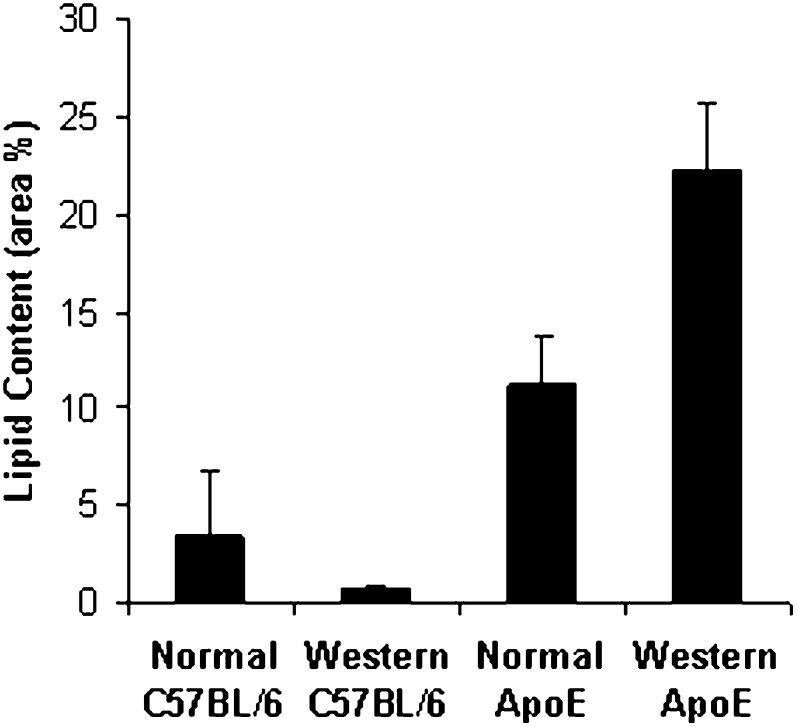
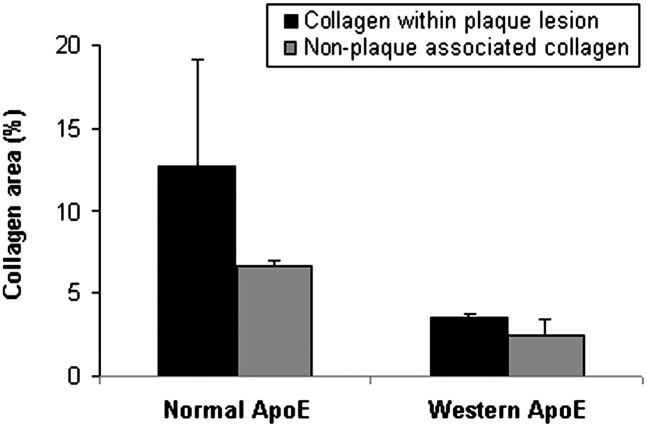
We characterized several cellular and structural features of early stage Type II/III atherosclerotic plaques in an established model of atherosclerosis-the ApoE-deficient mouse-by using a multimodal, coregistered imaging system that integrates three nonlinear optical microscopy (NLOM) contrast mechanisms: coherent anti-Stokes Raman scattering (CARS), second harmonic generation (SHG), and two-photon excitation fluorescence (TPEF). Specifically, the infiltration of lipid-rich macrophages and the structural organization of collagen and elastin fibers were visualized by CARS, SHG, and TPEF, respectively, in thick tissue specimens without the use of exogenous labels or dyes. Label-free CARS imaging of macrophage accumulation was confirmed by histopathology using CD68 staining. A high-fat, high-cholesterol Western diet resulted in an approximate 2-fold increase in intimal plaque area, defined by CARS signals of lipid-rich macrophages. Additionally, analysis of collagen distribution within lipid-rich plaque regions revealed nearly a 4-fold decrease in the Western diet-fed mice, suggesting NLOM sensitivity to increased matrix metalloproteinase (MMP) activity and decreased smooth muscle cell (SMC) accumulation. These imaging results provide significant insight into the structure and composition of early stage Type II/III plaque during formation and allow for quantitative measurements of the impact of diet and other factors on critical plaque and arterial wall features.
Figures


Similar articles
-
Lipid crystals mechanically stimulate adjacent extracellular matrix in advanced atherosclerotic plaques.Atherosclerosis. 2014 Dec;237(2):769-76. doi: 10.1016/j.atherosclerosis.2014.10.018. Epub 2014 Oct 31. Atherosclerosis. 2014. PMID: 25463119
-
Multiplex coherent anti-stokes Raman spectroscopy images intact atheromatous lesions and concomitantly identifies distinct chemical profiles of atherosclerotic lipids.Circ Res. 2010 Apr 30;106(8):1332-41. doi: 10.1161/CIRCRESAHA.109.208678. Epub 2010 Mar 18. Circ Res. 2010. PMID: 20299664
-
Fibronectin Containing Extra Domain A Induces Plaque Destabilization in the Innominate Artery of Aged Apolipoprotein E-Deficient Mice.Arterioscler Thromb Vasc Biol. 2018 Mar;38(3):500-508. doi: 10.1161/ATVBAHA.117.310345. Epub 2018 Jan 11. Arterioscler Thromb Vasc Biol. 2018. PMID: 29326316 Free PMC article.
-
Endothelial Cell-Specific Deletion of P2Y2 Receptor Promotes Plaque Stability in Atherosclerosis-Susceptible ApoE-Null Mice.Arterioscler Thromb Vasc Biol. 2017 Jan;37(1):75-83. doi: 10.1161/ATVBAHA.116.308561. Epub 2016 Nov 17. Arterioscler Thromb Vasc Biol. 2017. PMID: 27856454 Free PMC article.
-
Label-free imaging of lipid dynamics using Coherent Anti-stokes Raman Scattering (CARS) and Stimulated Raman Scattering (SRS) microscopy.Curr Opin Genet Dev. 2011 Oct;21(5):585-90. doi: 10.1016/j.gde.2011.09.003. Epub 2011 Sep 22. Curr Opin Genet Dev. 2011. PMID: 21945002 Free PMC article. Review.
Cited by
-
Shedding new light on lipid biology with coherent anti-Stokes Raman scattering microscopy.J Lipid Res. 2010 Nov;51(11):3091-102. doi: 10.1194/jlr.R008730. Epub 2010 Aug 16. J Lipid Res. 2010. PMID: 20713649 Free PMC article. Review.
-
Early PQQ supplementation has persistent long-term protective effects on developmental programming of hepatic lipotoxicity and inflammation in obese mice.FASEB J. 2017 Apr;31(4):1434-1448. doi: 10.1096/fj.201600906R. Epub 2016 Dec 22. FASEB J. 2017. PMID: 28007783 Free PMC article.
-
Identification of cholesterol crystals in plaques of atherosclerotic mice using hyperspectral CARS imaging.J Lipid Res. 2011 Dec;52(12):2177-2186. doi: 10.1194/jlr.M018077. Epub 2011 Sep 23. J Lipid Res. 2011. PMID: 21949051 Free PMC article.
-
G Protein-Coupled Bile Acid Receptor TGR5 Activation Inhibits Kidney Disease in Obesity and Diabetes.J Am Soc Nephrol. 2016 May;27(5):1362-78. doi: 10.1681/ASN.2014121271. Epub 2015 Sep 30. J Am Soc Nephrol. 2016. PMID: 26424786 Free PMC article.
-
Picosecond spectral coherent anti-Stokes Raman scattering imaging with principal component analysis of meibomian glands.J Biomed Opt. 2011 Feb;16(2):021104. doi: 10.1117/1.3533716. J Biomed Opt. 2011. PMID: 21361667 Free PMC article.
References
-
- Narula J., Strauss H. W. 2005. Imaging of unstable atherosclerotic lesions. Eur. J. Nucl. Med. Mol. Imaging. 32: 1–5. - PubMed
-
- Virmani R., Kolodgie F. D., Burke A. P., Finn A. V., Gold H. K., Tulenko T. N., Wrenn S. P., Narula J. 2005. Atherosclerotic plaque progression and vulnerability to rupture: angiogenesis as a source of intraplaque hemorrhage. Arterioscler. Thromb. Vasc. Biol. 25: 2054–2061. - PubMed
-
- Marcu L., Fang Q., Jo J. A., Papaioannou T., Dorafshar A., Reil T., Qiao J. H., Baker J. D., Freischlag J. A., Fishbein M. C. 2005. In vivo detection of macrophages in a rabbit atherosclerotic model by time-resolved laser-induced fluorescence spectroscopy. Atherosclerosis. 181: 295–303. - PMC - PubMed
-
- Waxman S., Ishibashi F., Muller J. E. 2006. Detection and treatment of vulnerable plaques and vulnerable patients: novel approaches to prevention of coronary events. Circulation. 114: 2390–2411. - PubMed
-
- Kaufmann B. A., Lindner J. R. 2007. Molecular imaging with targeted contrast ultrasound. Curr. Opin. Biotechnol. 18: 11–16. - PubMed
Publication types
MeSH terms
Substances
Grants and funding
LinkOut - more resources
Full Text Sources
Other Literature Sources
Medical
Molecular Biology Databases
Miscellaneous
