

Selective stimulation of the human femoral nerve with a flat interface nerve electrode
- PMID: 20208125
- PMCID: PMC2915830
- DOI: 10.1088/1741-2560/7/2/026006
Selective stimulation of the human femoral nerve with a flat interface nerve electrode
Abstract
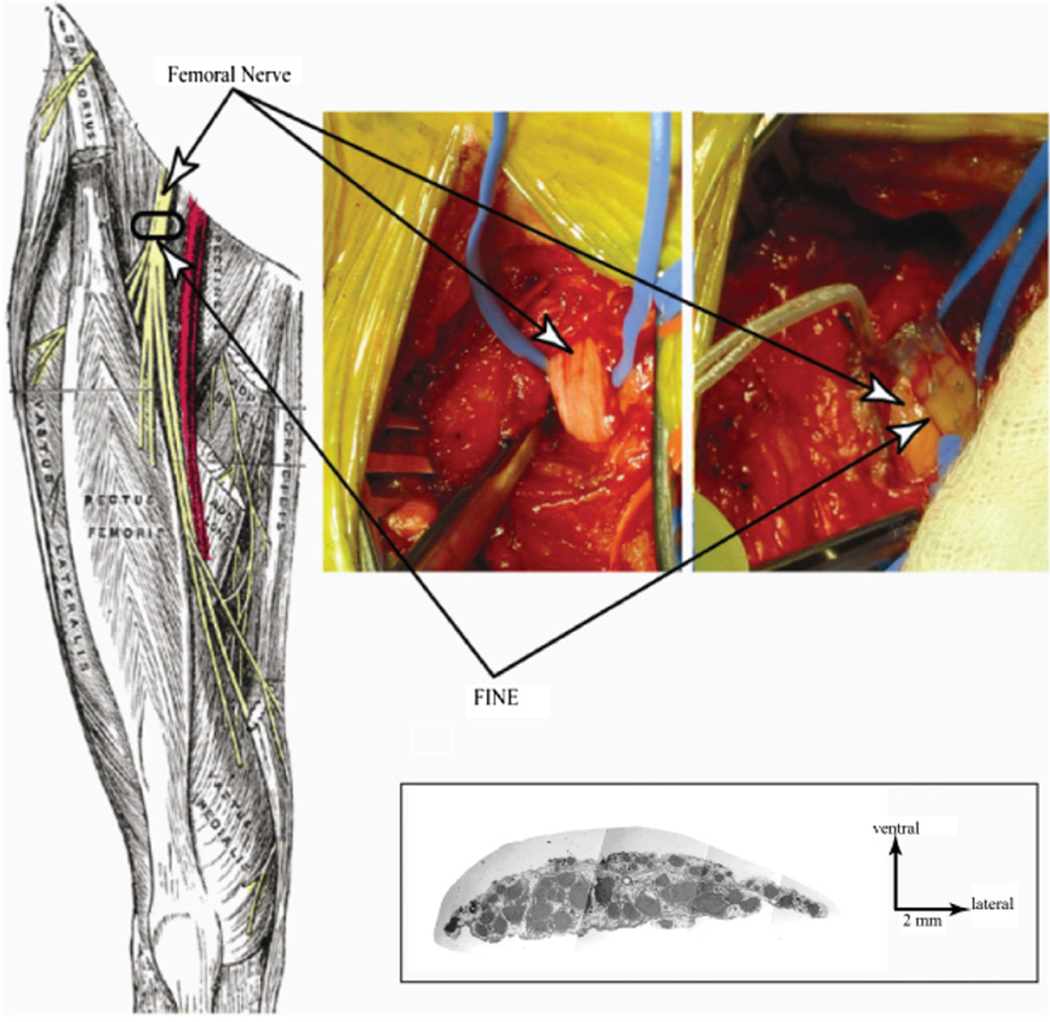
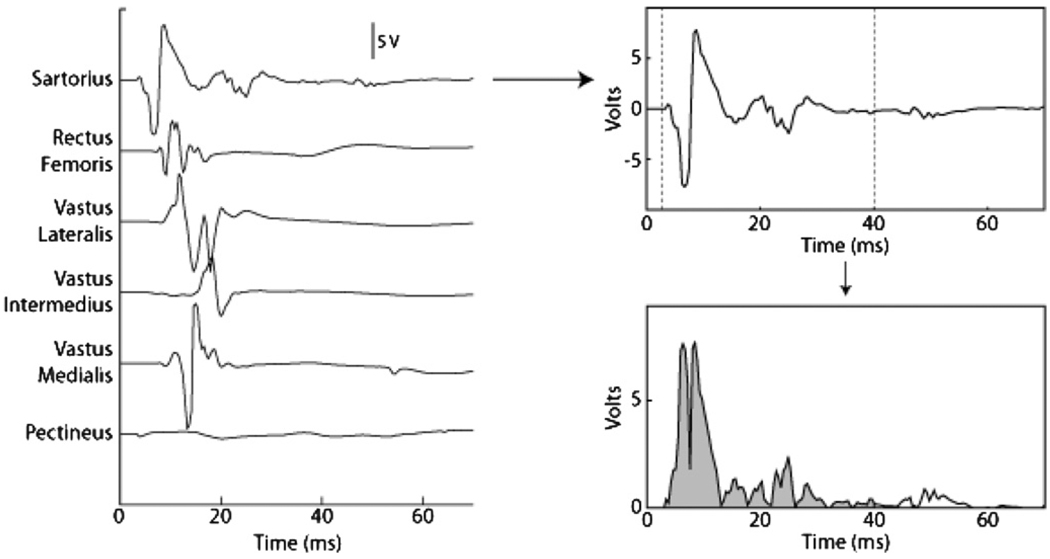
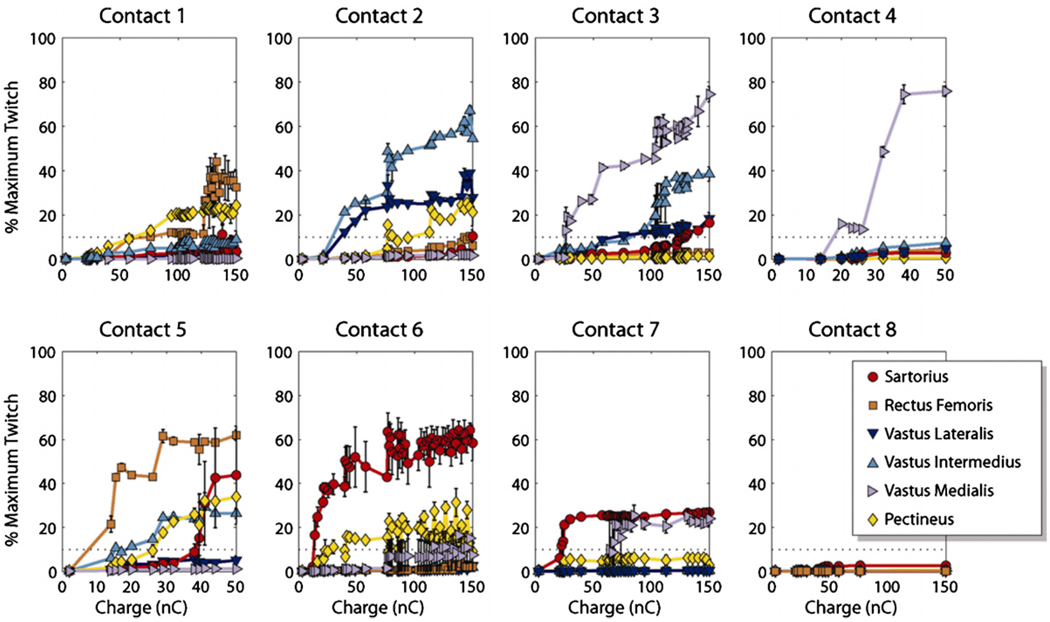
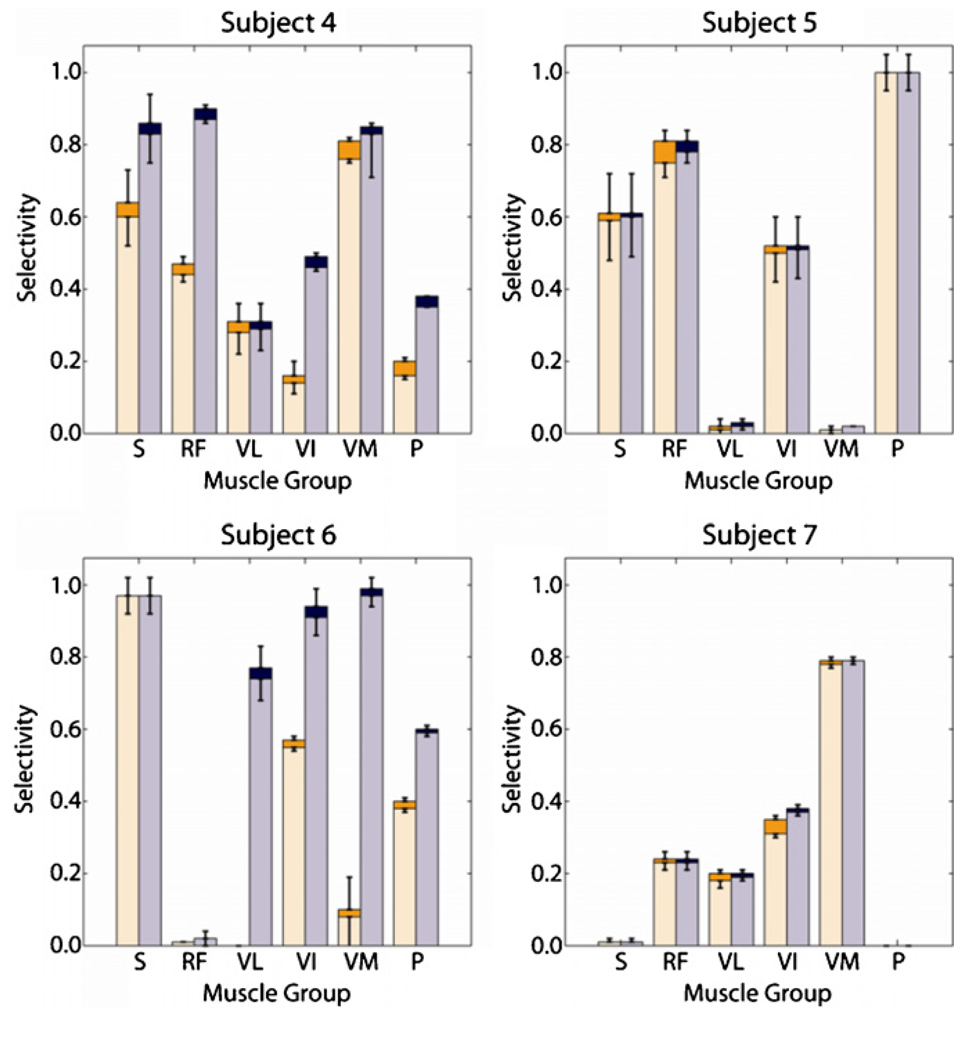
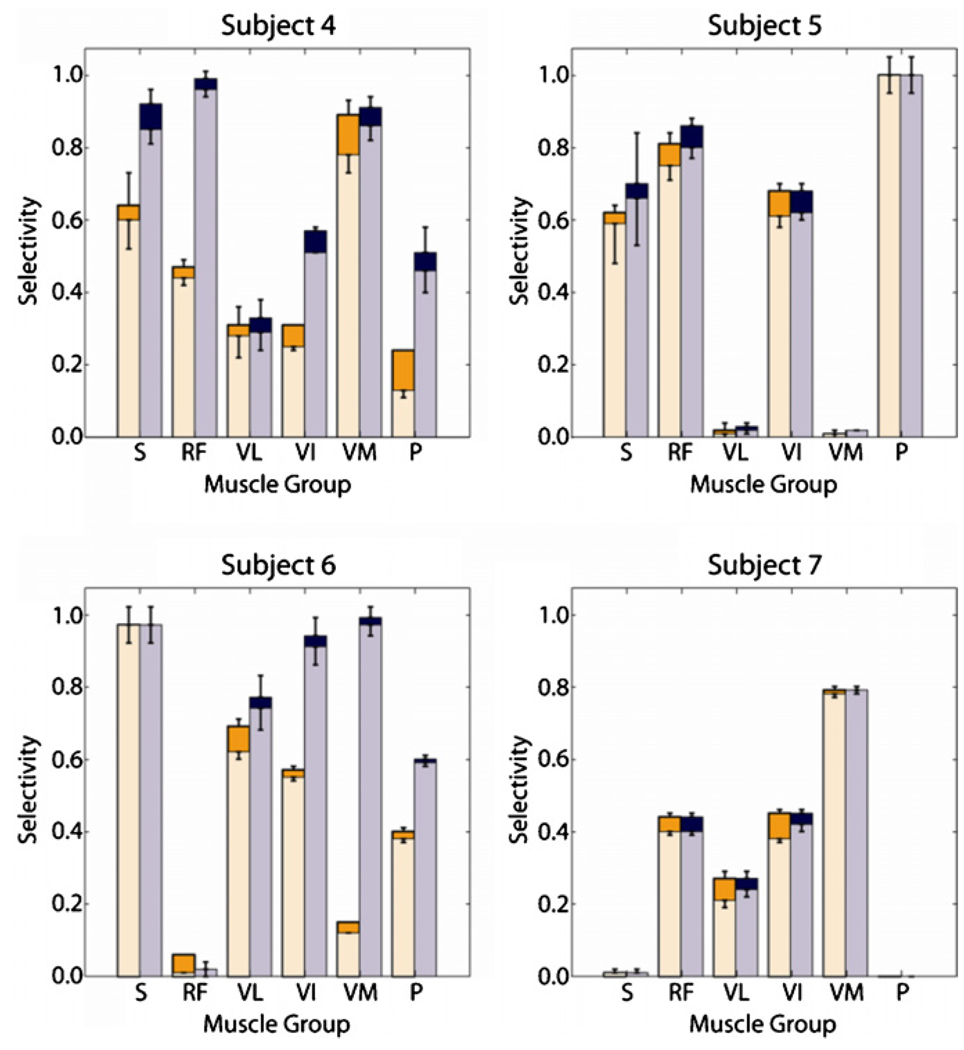
In humans, we tested the hypothesis that a flat interface nerve electrode (FINE) placed around the femoral nerve trunk can selectively stimulate each muscle the nerve innervates. In a series of intraoperative trials during routine vascular surgeries, an eight-contact FINE was placed around the femoral nerve between the inguinal ligament and the first nerve branching point. The capability of the FINE to selectively recruit muscles innervated by the femoral nerve was assessed with electromyograms (EMGs) of the twitch responses to electrical stimulation. At least four of the six muscles innervated by the femoral nerve were independently and selectively recruited in all subjects. Of these, at least one muscle was a hip flexor and at least two were knee extensors. Results from the intraoperative experiments were used to estimate the potential for the electrode to restore knee extension and hip flexion through functional electrical stimulation. Normalized EMGs and biomechanical simulations were used to estimate joint moments and functional efficacy. Estimated knee extension moments exceed the threshold required for the sit-to-stand transition.
Figures


Similar articles
-
Intraoperative demonstration of selective stimulation of the common human femoral nerve with a FINE.Annu Int Conf IEEE Eng Med Biol Soc. 2009;2009:610-3. doi: 10.1109/IEMBS.2009.5332757. Annu Int Conf IEEE Eng Med Biol Soc. 2009. PMID: 19963718 Free PMC article.
-
Selective activation of the human tibial and common peroneal nerves with a flat interface nerve electrode.J Neural Eng. 2013 Oct;10(5):056006. doi: 10.1088/1741-2560/10/5/056006. Epub 2013 Aug 5. J Neural Eng. 2013. PMID: 23918148 Free PMC article.
-
Intraoperative evaluation of the spiral nerve cuff electrode on the femoral nerve trunk.J Neural Eng. 2009 Dec;6(6):066005. doi: 10.1088/1741-2560/6/6/066005. Epub 2009 Nov 9. J Neural Eng. 2009. PMID: 19901448 Free PMC article.
-
A model of selective activation of the femoral nerve with a flat interface nerve electrode for a lower extremity neuroprosthesis.IEEE Trans Neural Syst Rehabil Eng. 2008 Apr;16(2):195-204. doi: 10.1109/TNSRE.2008.918425. IEEE Trans Neural Syst Rehabil Eng. 2008. PMID: 18403289 Free PMC article.
-
Contributions to the understanding of gait control.Dan Med J. 2014 Apr;61(4):B4823. Dan Med J. 2014. PMID: 24814597 Review.
Cited by
-
Intraoperative Responses May Predict Chronic Performance of Composite Flat Interface Nerve Electrodes on Human Femoral Nerves.IEEE Trans Neural Syst Rehabil Eng. 2019 Dec;27(12):2317-2327. doi: 10.1109/TNSRE.2019.2951079. Epub 2019 Nov 4. IEEE Trans Neural Syst Rehabil Eng. 2019. PMID: 31689196 Free PMC article.
-
Motor neuron activation in peripheral nerves using infrared neural stimulation.J Neural Eng. 2014 Feb;11(1):016001. doi: 10.1088/1741-2560/11/1/016001. Epub 2013 Dec 5. J Neural Eng. 2014. PMID: 24310923 Free PMC article.
-
Interfacing with the nervous system: a review of current bioelectric technologies.Neurosurg Rev. 2019 Jun;42(2):227-241. doi: 10.1007/s10143-017-0920-2. Epub 2017 Oct 23. Neurosurg Rev. 2019. PMID: 29063229 Free PMC article. Review.
-
Neural interfaces for somatosensory feedback: bringing life to a prosthesis.Curr Opin Neurol. 2015 Dec;28(6):574-81. doi: 10.1097/WCO.0000000000000266. Curr Opin Neurol. 2015. PMID: 26544029 Free PMC article. Review.
-
Motion control of the rabbit ankle joint with a flat interface nerve electrode.Muscle Nerve. 2015 Dec;52(6):1088-95. doi: 10.1002/mus.24654. Epub 2015 Sep 7. Muscle Nerve. 2015. PMID: 25786911 Free PMC article.
References
-
- Acosta AM. PhD thesis. Cleveland, OH: Department of Biomedical Engineering, Case Western Reserve University; 2002. Musculoskeletal modeling of the shoulder and elbow in cervical spinal cord injury.
-
- Bogey RA, et al. Comparison of across-subject EMG profiles using surface and multiple indwelling wire electrodes during gait. J. Electromyogr. Kinesiol. 2000;10:255–259. - PubMed
-
- Bogey RA, et al. An EMG-to-force processing approach for determining ankle muscle forces during normal human gait. IEEE Trans. Neural Syst. Rehabil. Eng. 2005;13:302–310. - PubMed
-
- Brand RA, et al. The sensitivity of muscle force predictions to changes in physiologic cross-sectional area. J. Biomech. 1986;19:589–596. - PubMed
-
- Branner A, Normann RA. A multielectrode array for intrafascicular recording and stimulation in sciatic nerve of cats. Brain Res. Bull. 2000;51:293–306. - PubMed
MeSH terms
Grants and funding
LinkOut - more resources
Full Text Sources
Other Literature Sources