. 2010 Apr;42(4):355-60.
doi: 10.1038/ng.546. Epub 2010 Mar 7.

Mixed linear model approach adapted for genome-wide association studies

Affiliations

Mixed linear model approach adapted for genome-wide association studies

Zhiwu Zhang et al. Nat Genet. 2010 Apr.

Abstract

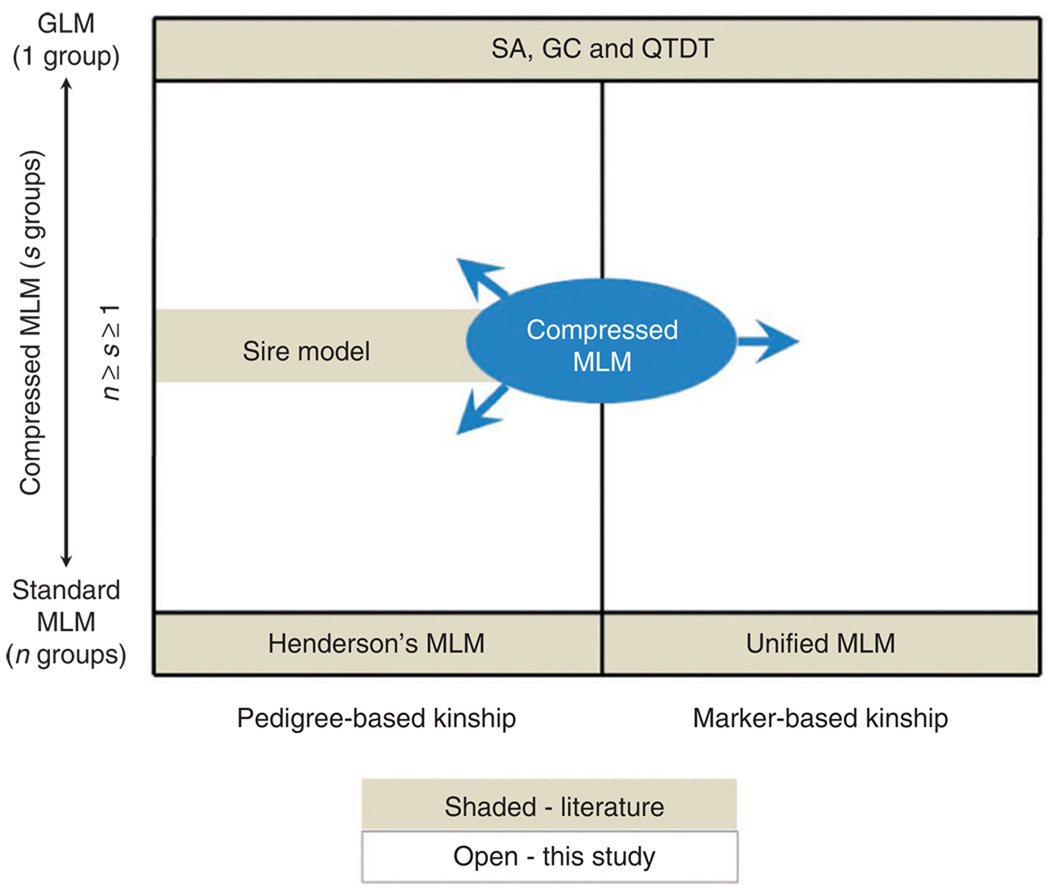
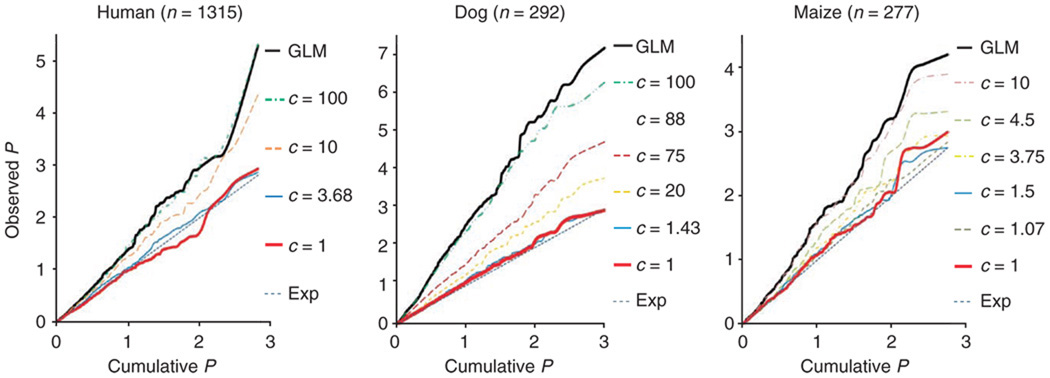
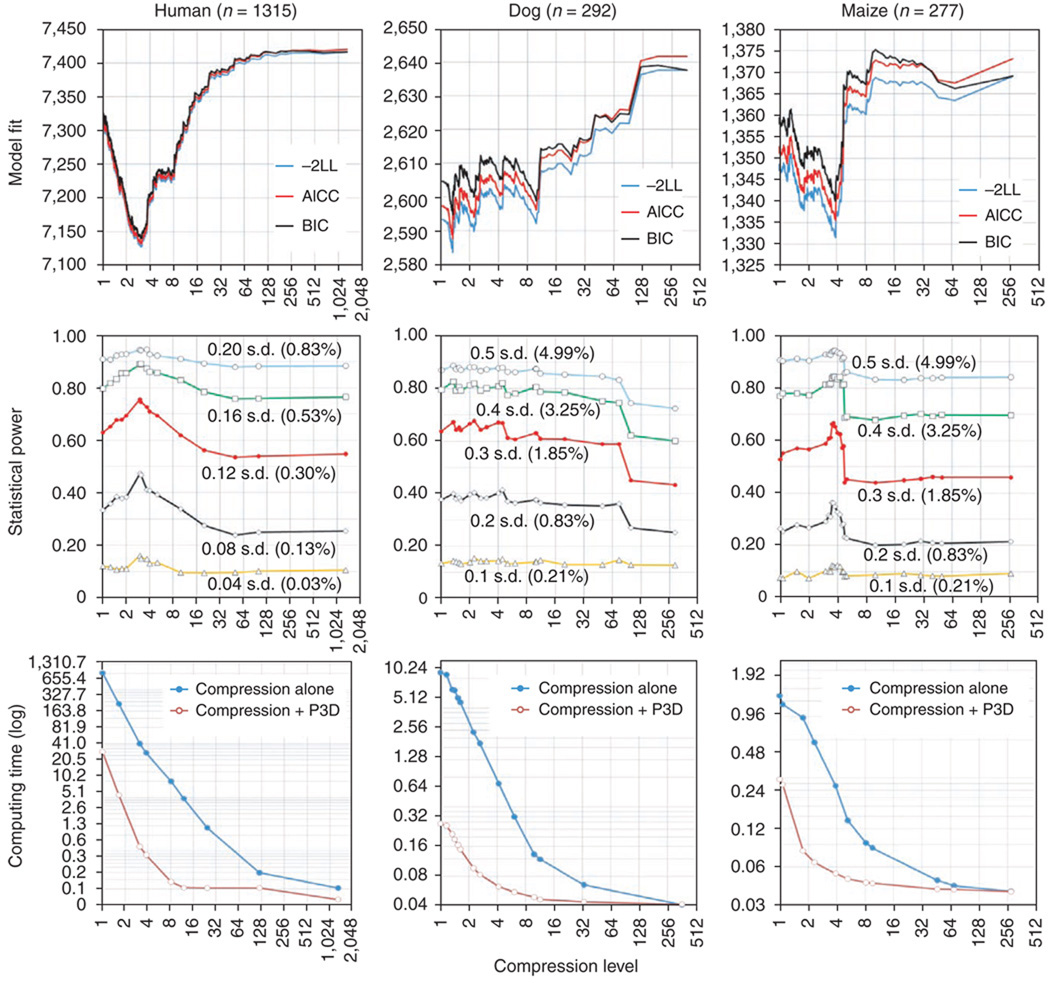
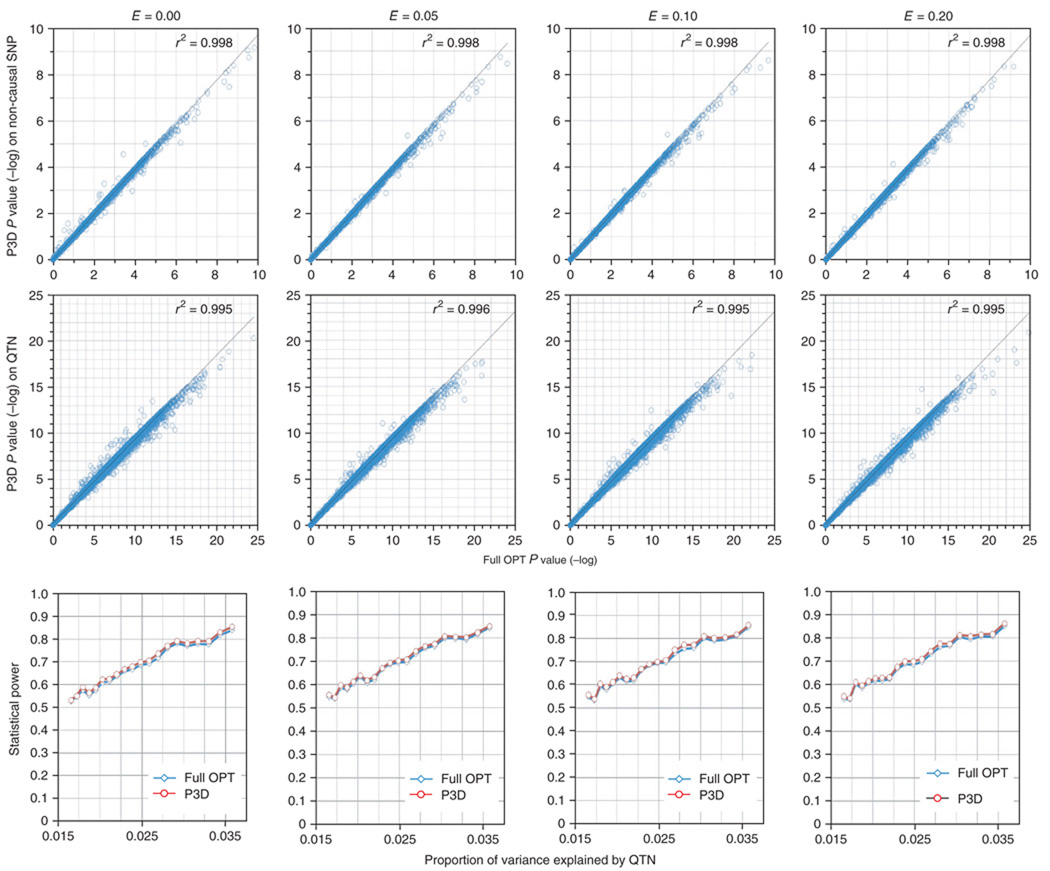
Mixed linear model (MLM) methods have proven useful in controlling for population structure and relatedness within genome-wide association studies. However, MLM-based methods can be computationally challenging for large datasets. We report a compression approach, called 'compressed MLM', that decreases the effective sample size of such datasets by clustering individuals into groups. We also present a complementary approach, 'population parameters previously determined' (P3D), that eliminates the need to re-compute variance components. We applied these two methods both independently and combined in selected genetic association datasets from human, dog and maize. The joint implementation of these two methods markedly reduced computing time and either maintained or improved statistical power. We used simulations to demonstrate the usefulness in controlling for substructure in genetic association datasets for a range of species and genetic architectures. We have made these methods available within an implementation of the software program TASSEL.


Figures

Figure 1
Figure 1
The forms of MLM classified by the random effect size and types of kinship. The GLM and standard MLM are the two extremes of the compressed MLM with the number of groups determined as 1 and n (number of individuals), respectively. The sire model is a special case of the compressed MLM, with the groups determined as the sires derived from pedigrees. Kinship used in Henderson’s MLM was calculated from the pedigrees. It was extended to marker-based kinship in the unified MLM. The GLM approach appears in many formats in various GWAS, including structure association (SA), genomic control (GC) and the quantitative transmission disequilibrium test (QTDT). The compressed MLM can be flexibly applied to the entire area by varying the number of groups (s), including the area investigated previously (shaded area) and the area proposed in this study (open area).
Figure 2
Figure 2
Quantile-quantile plots of type I error (false positive) rates of association tests using the compressed MLM under different compression levels. The observed phenotypes are height in humans, hip dysplasia (Norberg angle) in dogs and flowering time (days to pollination) in maize. The distributions of P values are shown by plotting the observed P values against the cumulative P values in the negative log10 scale. Under the assumption that this set of genetic markers are unlinked to the polymorphism controlling the phenotypes, the P values of the association tests have a uniform distribution, indicated by the expected diagonal line (Exp). A statistical approach that has a distribution closer to the diagonal line indicates a better control for type I errors. The GLM that is equivalent to the compressed MLM at the maximum compression level had the most type I errors. For all the species, at least one compression level was found at which the compressed MLM performed better than the standard MLM, which is equivalent to the compressed MLM with compression level of 1.
Figure 3
Figure 3
The performance of the compressed MLM under different compression levels (horizontal axis). The two extremes of the compression level at 1 and n (the number of individuals) correspond to the standard MLM and the GLM, respectively. Performances were examined based on model fit, statistical power and computing time (s). The observed phenotypes are height in humans, hip dysplasia (Norberg angle) in dogs and flowering time (days to pollination) in maize. Individuals in each of the datasets were clustered into groups according to kinship by using the UPGMA algorithm implemented by proc cluster in SAS. Model fit was evaluated using negative log likelihood (–2LL), adjusted Akaike information criterion (AICC) and Bayesian information content (BIC). Smaller values of –2LL, AICC and BIC indicate better fit. The statistical power was evaluated for QTNs with different size effect. The size of QTN effect is expressed in the unit of phenotypic standard deviation (s.d.). The average computing time was calculated from the observed CPU time for association tests on 647 markers in human datasets; 1,000 markers in dog datasets; and 553 markers in maize datasets. The computations were performed by proc mixed in SAS on a computer from Dell (Optiplex 755) with two physical CPUs (E6850 @ 3.00 GHz) and 3.25 GB RAM operated under Windows XP.
Figure 4
Figure 4
The P values and statistical power of association tests obtained by using the one-step MLM with the full optimization (full OPT) for all unknown parameters compared to P3D on a maize phenotype simulated with different epistatic effects (E). The phenotype was controlled by 20 QTNs, which were randomly assigned to the SNPs from the maize dataset. Heritability was defined as the proportion of additive genetic variance over the total variance (the sum of additive genetic variance, epistatic variance and residual variance) and was set at 0.5. Because all maize used here belonged to inbred lines, no dominance effect was included. The experiment was repeated 1,000 times. For each replicate, the number of non-causal SNPs that were randomly sampled was the same as the number of causal QTNs. The top two panels display the P values using the full OPT (x axis) and P3D (y axis). Each dot represents a test on a non-causal SNP (top) and a causal QTN (middle). The P values from P3D are highly correlated with the ones from the full OPT for the non-causal SNPs and causal QTNs (r2 > 99%). The empirical statistical power for detecting the causal QTNs is displayed (bottom) as a function of the proportion of the total variation explained (x axis). The P3D approach and the full OPT had approximately the same statistical power for detecting the causal QTNs.

References

    1. Abiola O, et al. The nature and identification of quantitative trait loci: a community’s view. Nat. Rev. Genet. 2003;4:911–916. - PMC - PubMed
    1. Pritchard JK, Stephens M, Donnelly P. Inference of population structure using multilocus genotype data. Genetics. 2000;155:945–959. - PMC - PubMed
    1. Devlin B, Roeder K. Genomic control for association studies. Biometrics. 1999;55:997–1004. - PubMed
    1. Abecasis GR, Cardon LR, Cookson WO. A general test of association for quantitative traits in nuclear families. Am. J. Hum. Genet. 2000;66:279–292. - PMC - PubMed
    1. Yu J, et al. A unified mixed-model method for association mapping that accounts for multiple levels of relatedness. Nat. Genet. 2006;38:203–208. - PubMed

Publication types