. 2010 Apr;42(4):343-7.
doi: 10.1038/ng.545. Epub 2010 Mar 7.

Nucleosome dynamics define transcriptional enhancers

Affiliations

Nucleosome dynamics define transcriptional enhancers

Housheng Hansen He et al. Nat Genet. 2010 Apr.

Abstract

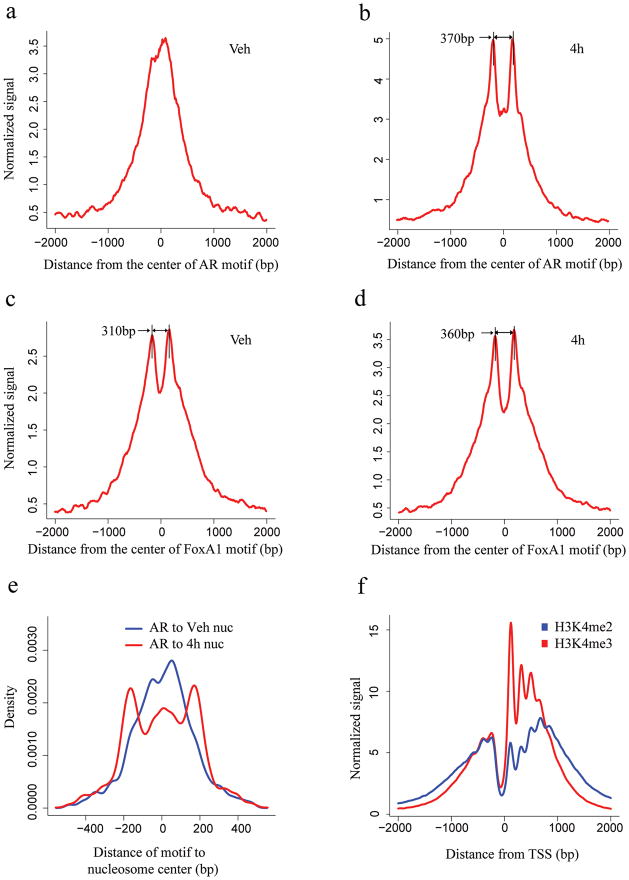
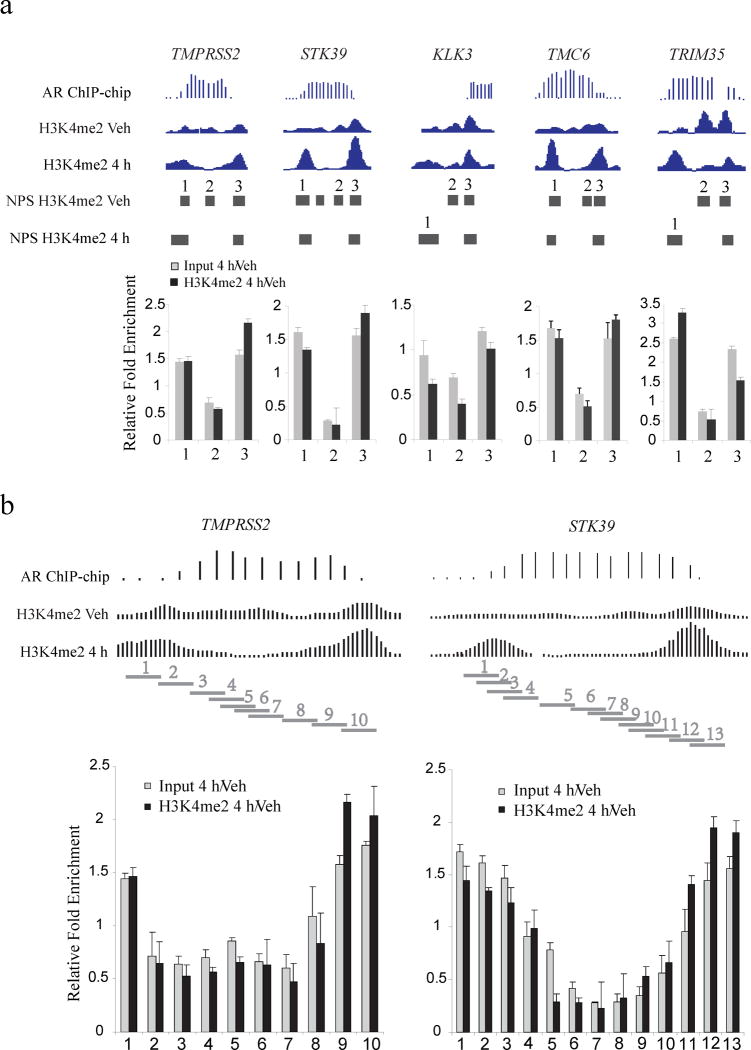
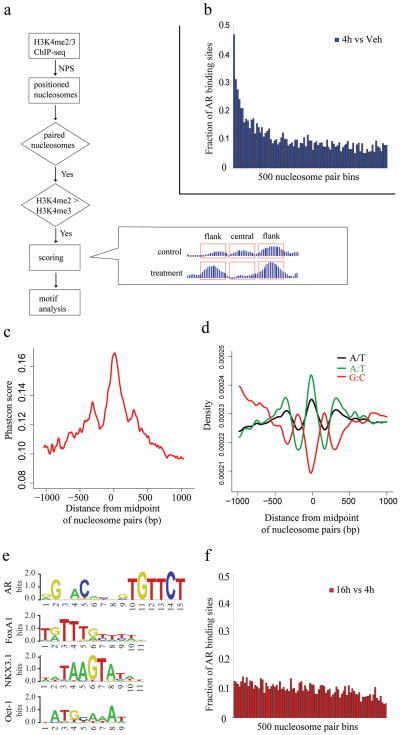
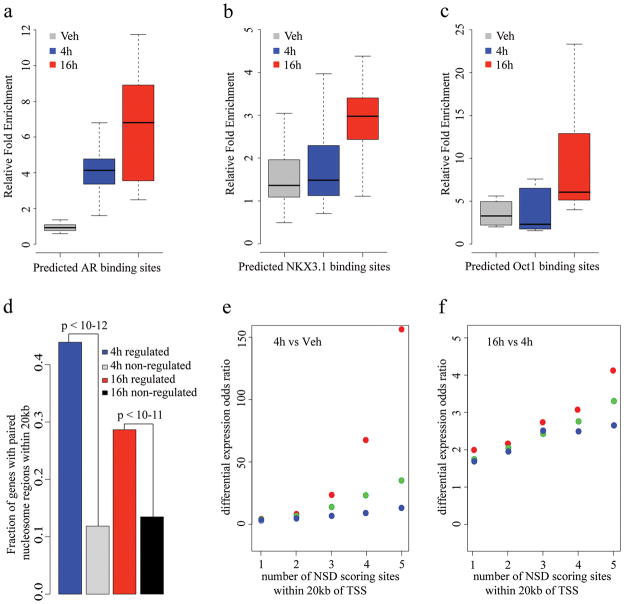
Chromatin plays a central role in eukaryotic gene regulation. We performed genome-wide mapping of epigenetically marked nucleosomes to determine their position both near transcription start sites and at distal regulatory elements, including enhancers. In prostate cancer cells, where androgen receptor binds primarily to enhancers, we found that androgen treatment dismisses a central nucleosome present at androgen receptor binding sites that is flanked by a pair of marked nucleosomes. A new quantitative model built on the behavior of such nucleosome pairs correctly identified regions bound by the regulators of the immediate androgen response, including androgen receptor and FOXA1. More importantly, this model also correctly predicted previously unidentified binding sites for other transcription factors present after prolonged androgen stimulation, including OCT1 and NKX3-1. Therefore, quantitative modeling of enhancer structure provides a powerful predictive method to infer the identity of transcription factors involved in cellular responses to specific stimuli.


Figures

Figure 1
Figure 1. Signal distribution and nucleosome position analysis in the AR and FoxA1 binding regions identified by ChIP-chip experiment and the TSS
H3K4me2 signal distribution relative to the center of the AR motif (a, b) and FoxA1 motif (c, d) in the binding regions. The x-axis represents the distance to the center of the best AR or FoxA1 motif match in a given binding site. The y-axis represents normalized ChIP-Seq tag count numbers. “Veh” represents the unstimulated condition; “4h” represents stimulated conditions with treatment of DHT for 4 hours. (e) Distance from the AR motif to the center of the nearest nucleosome in the AR binding sites under vehicle (red) and 4 hours after DHT stimulation (blue). (f) H3K4m2 and H3K4me3 signal distribution relative to the TSS.
Figure 2
Figure 2. qPCR validation of the nucleosomes stabilized-destabilized around AR binding sites
(a) Five AR binding sites near the genes TMPRSS2, STK39, KLK3, TMC6 and TRIM35. “AR ChIP-chip” represents the AR ChIP-chip signals; “H3K4me2 Veh” and “H3K4me2 4h” represent H3K4me2 ChIP-Seq signals before and after 4 hours of DHT treatment. “Input 4h/Veh” represents the qPCR assay of nucleosome fold change for DHT treatment relative to vehicle; “H3K4me2 4h/Veh” represents the qPCR assay of fold change for H3K4me2 signal for DHT treatment relative to vehicle, standard deviation is shown. Each horizontal bar represents a NPS peak region. (b) Detailed qPCR analysis of the AR binding sites near the genes TMPRSS2 and TMC6. Each horizontal bar represents a qPCR amplification region.
Figure 3
Figure 3. Motif analysis in the paired nucleosome regions
(a) Flowchart of the prediction model. The formula for the NSD score is described in “Methods” section. “treatment” and “control” refer to treatment and vehicle control conditions, respectively. “flank” refers to the 200bp of sequence centered on each flanking nucleosome, and “central” refers to the sequence between these regions. (b) The fraction of AR binding sites in score ranked paired nucleosome bins with decreasing score (4h vs. Veh). Paired nucleosome regions are ranked by scores representing the differences in H3K4me2 tag counts before and after DHT treatment. These ranked regions are grouped into bins of 500. Represented here is the number of regions in each bin that overlap with AR ChIP-chip enriched regions. (c) Evolutionary conservation in the vicinity of the 5000 highest scoring nucleosome pairs. Mean PhastCons scores representing DNA sequence conservation over 17 species is plotted as a function of the distance from the midpoint between paired nucleosomes. (d) DNA sequence content associated with nucleosome positioning. The 5000 highest scoring paired nucleosome regions, aligned at the midpoint, were analyzed for simple DNA sequence features: the distribution of A/T mononucleotides (black), G:C dinucleotides (red) or A:T dinucleotides (green). (e) Logos of AR, FoxA1, NKX3.1 and Oct1 motifs from TRANSFAC library. (f) The fraction of AR binding sites in score ranked paired nucleosome bins with decreasing score (16h vs. 4h).
Figure 4
Figure 4. ChIP-qPCR and gene expression analysis of NSD scoring sites
ChIP-qPCR validation of predicted (a)AR, (b)NKX3.1 and (c)Oct1 binding sites. Box plots were generated from ChIP-qPCR data obtained from three independent experiment testing 10 sites for AR, 22 sites for NKX3.1 and 9 sites forOct1. The individual ChIP-qPCR assays are shown in Supplementary Fig. 5. (d) Correlation of paired nucleosome regions with gene expression. The fraction of differentially regulated genes with paired nucleosome regions within 20 kb is shown. The top 5000 paired nucleosome regions were selected under the conditions of DHT 4 hours vs. vehicle and DHT 16 hours vs. DHT 4 hours. Differentially regulated genes were identified as described in the “Methods” section. “4hregulated” represents the fraction of DHT 4 hours vs. vehicle differentially regulated genes with at least one DHT 4 hour vs. vehicle paired nucleosome region within 20kb of the transcription start site. “4h non-regulated” represents the fraction of non-regulated genes under the same condition. “16h regulated” and “16h non-regulated” represent the fractions under the condition of DHT 16 hours vs. DHT 4 hours. Correlation of score and number of NSD scoring sites and up-regulated gene expression, (e) 4h vs Veh, (f) 16h vs 4h. X axis represents the lower bound n of the number of sites within 20kb of the TSS of a gene, Y axis represents the odds ratio calculated by the formula (up-regulated genes with at least n sites/non-regulated genes with at least n sites)/(all up-regulated genes/all non-regulated genes). Red, green and blue dots represent the top 5000, 10,000 and 20,000 NSD score sites, respectively.

Comment in

References

    1. Beato M, Eisfeld K. Transcription factor access to chromatin. Nucleic Acids Res. 1997;25:3559–3563. - PMC - PubMed
    1. Narlikar L, Gordan R, Hartemink AJ. A nucleosome-guided map of transcription factor binding sites in yeast. PLoS Comput Biol. 2007;3:e215. - PMC - PubMed
    1. Ozsolak F, et al. Chromatin structure analyses identify miRNA promoters. Genes Dev. 2008;22:3172–3183. - PMC - PubMed
    1. Guttman M, et al. Chromatin signature reveals over a thousand highly conserved large non-coding RNAs in mammals. Nature. 2009;458:223–227. - PMC - PubMed
    1. Yuan GC, et al. Genome-scale identification of nucleosome positions in S. cerevisiae. Science. 2005;309:626–630. - PubMed

Publication types

Associated data