

Effects of chronic ethanol consumption on levels of adipokines in visceral adipose tissues and sera of rats
- PMID: 20208553
- PMCID: PMC4007662
- DOI: 10.1038/aps.2010.12
Effects of chronic ethanol consumption on levels of adipokines in visceral adipose tissues and sera of rats
Abstract
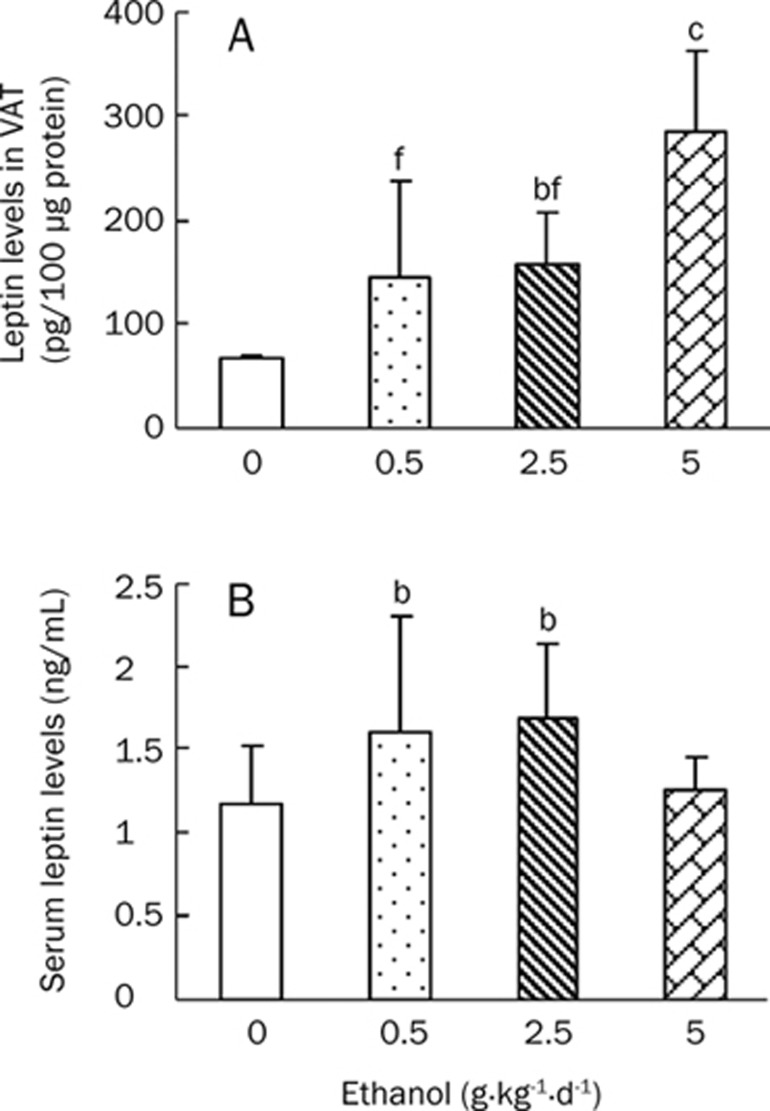
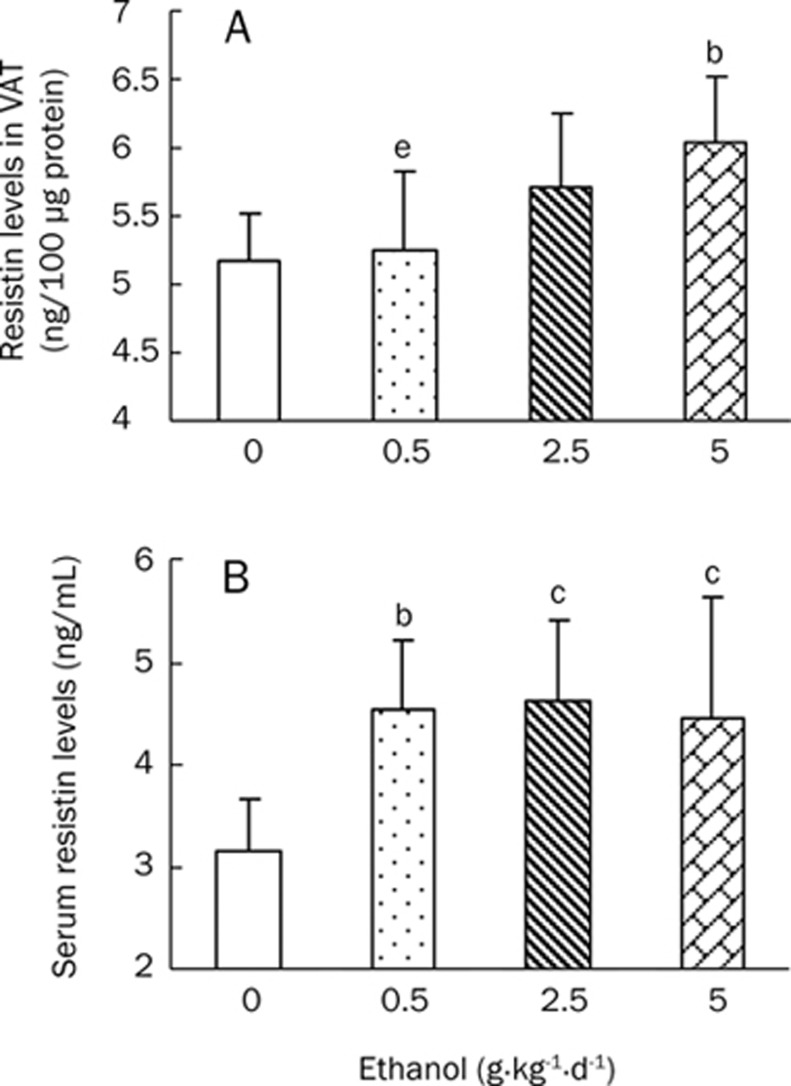
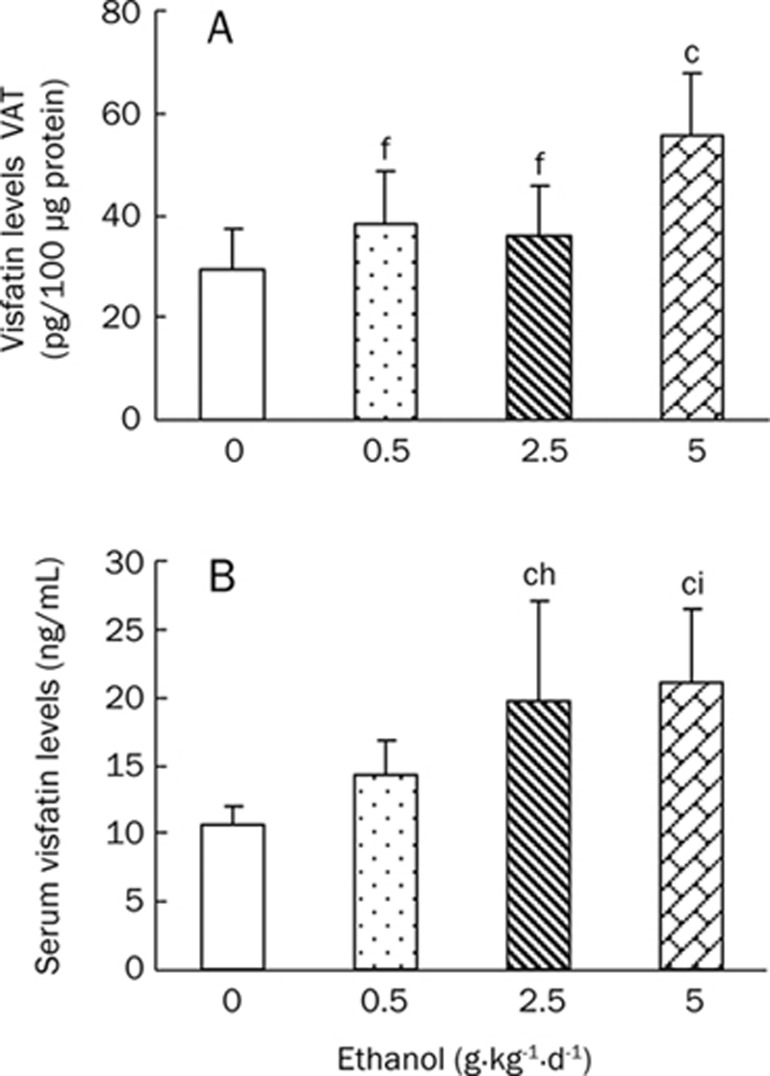
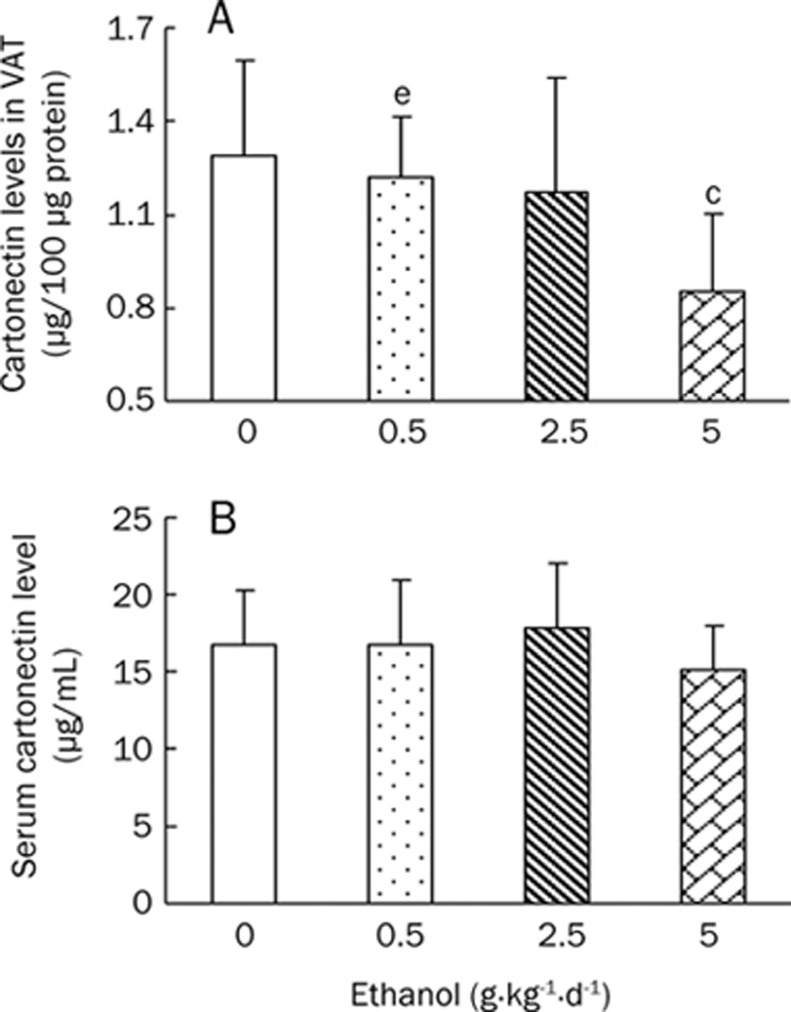
Aim: To investigate the effects of ethanol on adipokines (leptin, adiponectin, resistin, visfatin and cartonectin) levels in visceral adipose tissue (VAT) and sera, and explore the correlation between VAT and serum adipokine levels.
Methods: Forty-eight Wistar rats were randomly divided into control, low, middle and high ethanol treatment groups that received 0, 0.5, 2.5, or 5.0 g of ethanol x kg(-1) x d(-1), respectively, via gastric tubes for 22 weeks. The levels of fasting blood glucose (FBG) and fasting serum insulin (FINS) were measured and homeostasis model assessment of insulin resistance (HOMA-IR) values were calculated. Adipokines in perirenal and epididymal VAT and sera were measured by enzyme-linked immunosorbent assays (ELISAs).
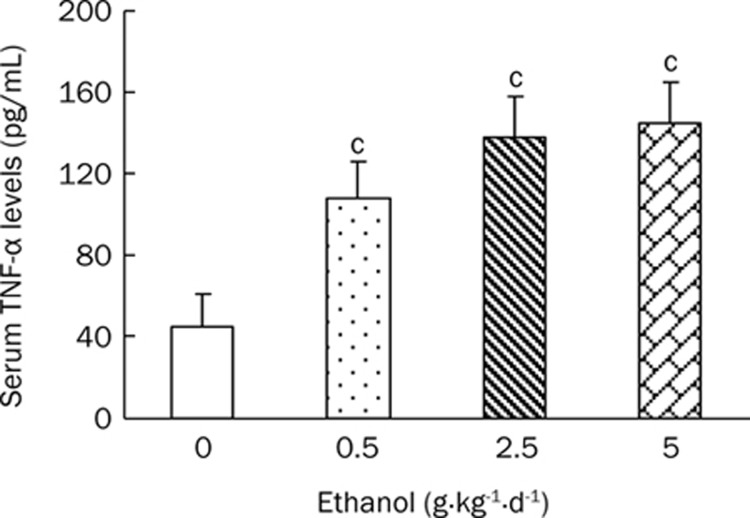
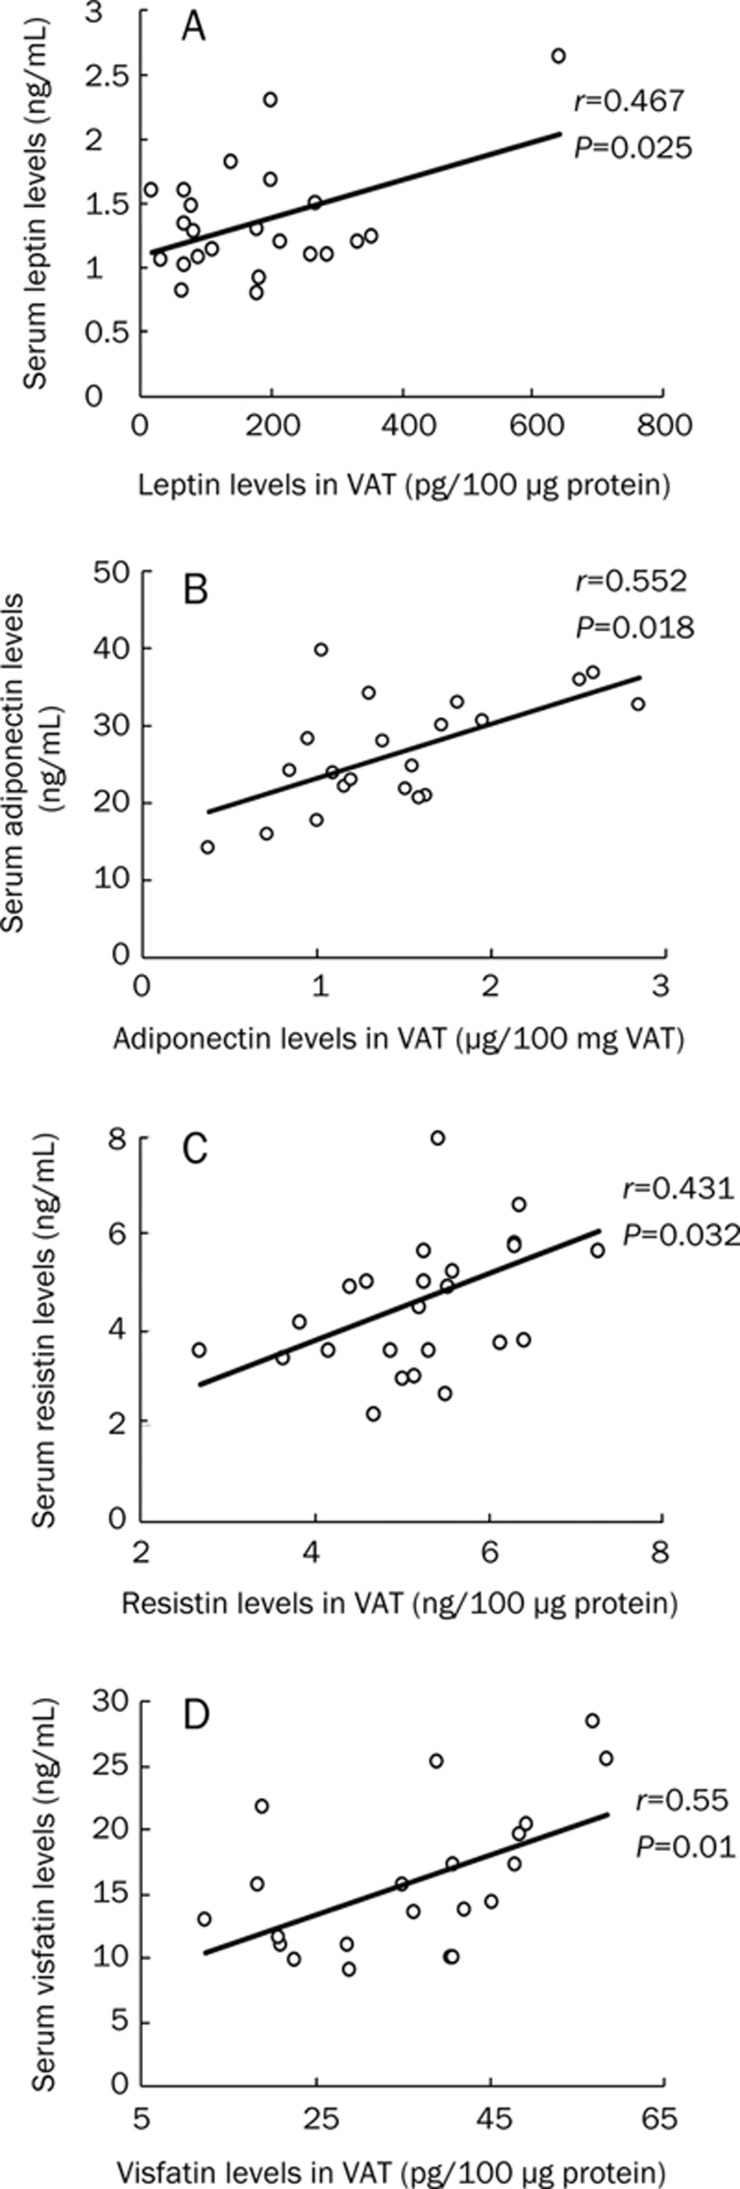
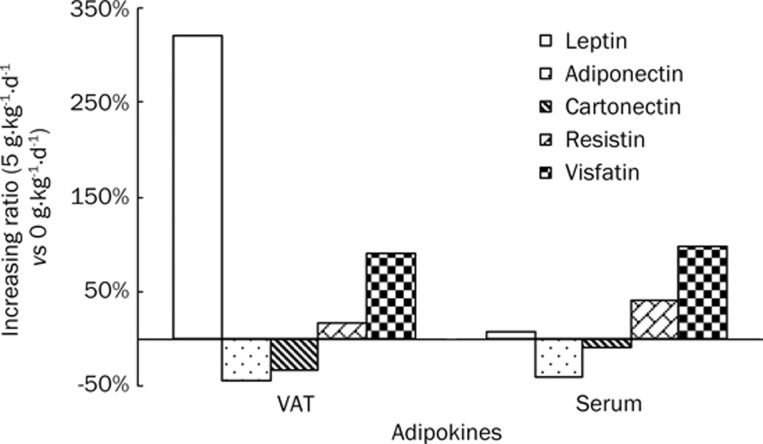
Results: High-dose treatments of ethanol (vs control group) significantly increased FINS (eg 37.86%) and HOMA-IR values (eg 40.63%). In VAT, levels of leptin, resistin and visfatin in the middle- and high-dose groups were significantly elevated, whereas adiponectin and cartonectin levels decreased. In sera, changes in adipokine levels were similar to that observed in VAT, with the exception of cartonectin. These ethanol-induced effects were dose-dependent. A positive correlation existed between VAT and serum adipokine levels, except for cartonectin.
Conclusion: Chronic ethanol consumption affects adipokine levels in VAT and sera in a dose-dependent manner, with the exception of serum cartonectin. The altered levels of adipokines in VAT and sera are positively correlated.
Figures

Similar articles
-
Splanchnic concentrations and postprandial release of visceral adipokines.Metabolism. 2010 May;59(5):664-70. doi: 10.1016/j.metabol.2009.09.011. Epub 2009 Nov 14. Metabolism. 2010. PMID: 19913846
-
Alcohol intake modifies leptin, adiponectin and resistin serum levels and their mRNA expressions in adipose tissue of rats.Endocr Regul. 2009 Jul;43(3):117-25. Endocr Regul. 2009. PMID: 19817506
-
Chronic ethanol consumption increases the levels of chemerin in the serum and adipose tissue of humans and rats.Acta Pharmacol Sin. 2012 May;33(5):652-9. doi: 10.1038/aps.2012.11. Epub 2012 Mar 26. Acta Pharmacol Sin. 2012. PMID: 22447224 Free PMC article.
-
[Adipokines: adiponectin, leptin, resistin and coronary heart disease risk].Przegl Lek. 2005;62 Suppl 3:69-72. Przegl Lek. 2005. PMID: 16521924 Review. Polish.
-
[New approach in the interpretation of adipose tissue].Orv Hetil. 2010 Aug 1;151(31):1252-60. doi: 10.1556/OH.2010.28901. Orv Hetil. 2010. PMID: 20656662 Review. Hungarian.
Cited by
-
Treatment of alcoholic liver disease.Therap Adv Gastroenterol. 2011 Jan;4(1):63-81. doi: 10.1177/1756283X10378925. Therap Adv Gastroenterol. 2011. PMID: 21317995 Free PMC article.
-
Alcohol, Adipose Tissue and Lipid Dysregulation.Biomolecules. 2017 Feb 16;7(1):16. doi: 10.3390/biom7010016. Biomolecules. 2017. PMID: 28212318 Free PMC article.
-
Effect of alcohol on adipose tissue: a review on ethanol mediated adipose tissue injury.Adipocyte. 2015 Apr 2;4(4):225-31. doi: 10.1080/21623945.2015.1017170. eCollection 2015 Oct-Dec. Adipocyte. 2015. PMID: 26451277 Free PMC article. Review.
-
Alcohol, White Adipose Tissue, and Brown Adipose Tissue: Mechanistic Links to Lipogenesis and Lipolysis.Nutrients. 2023 Jun 29;15(13):2953. doi: 10.3390/nu15132953. Nutrients. 2023. PMID: 37447280 Free PMC article. Review.
-
Association between genetically determined leptin and blood lipids considering alcohol consumption: a Mendelian randomisation study.BMJ Open. 2019 Nov 7;9(11):e026860. doi: 10.1136/bmjopen-2018-026860. BMJ Open. 2019. PMID: 31699712 Free PMC article.
References
-
- Campfield LA, Smith FJ, Guisez Y, Devos R, Burn P. Recombinant mouse ob protein: evidence for a peripheral signal linking adiposity and central neural networks. Science. 1995;269:546–9. - PubMed
-
- Maeda T, Abe M, Kurisu K, Jikko A, Furukawa S. Molecular cloning and characterization of a novel gene, CORS26, encoding putative secretory protein and its possible involvement in skeletal development. J Biol Chem. 2001;276:3628–34. - PubMed
-
- Weigert J, Neumeier M, Schäffler A, Fleck M, Schölmerich J, Schütz C, et al. The adiponectin paralog CORS-26 has anti-inflammatory properties and is produced by human monocytic cells. FEBS Lett. 2005;579:5565–70. - PubMed
Publication types
MeSH terms
Substances
LinkOut - more resources
Full Text Sources
