. 2010 May 20;29(20):2983-95.
doi: 10.1038/onc.2010.47. Epub 2010 Mar 8.

FOXM1 is a transcriptional target of ERalpha and has a critical role in breast cancer endocrine sensitivity and resistance

Affiliations

FOXM1 is a transcriptional target of ERalpha and has a critical role in breast cancer endocrine sensitivity and resistance

J Millour et al. Oncogene. .

Abstract

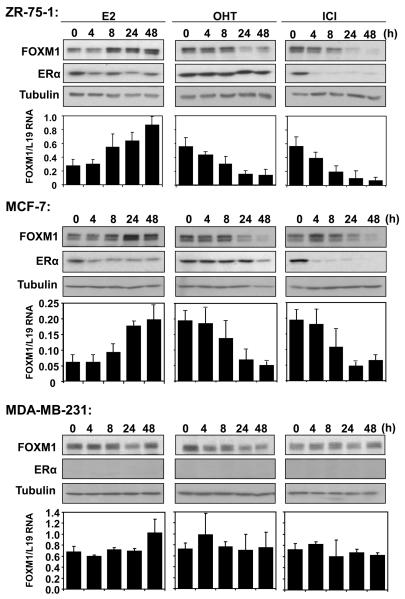
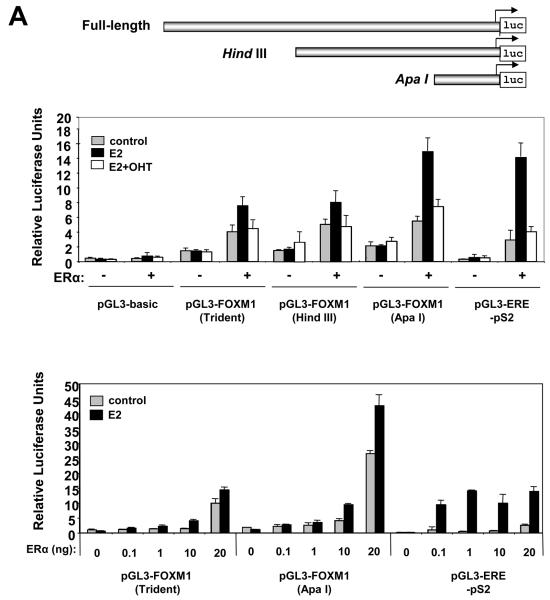
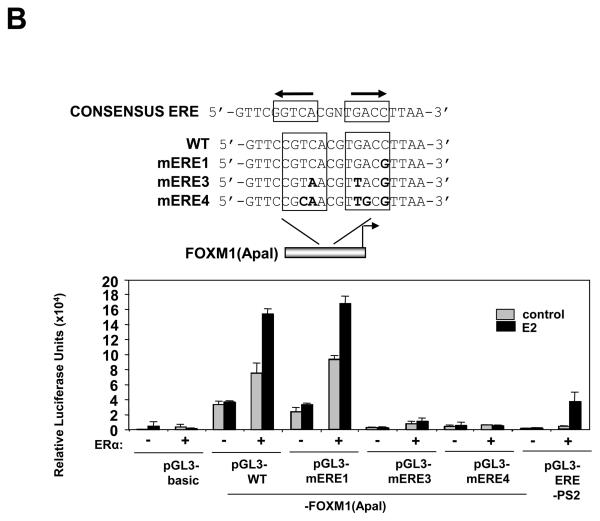
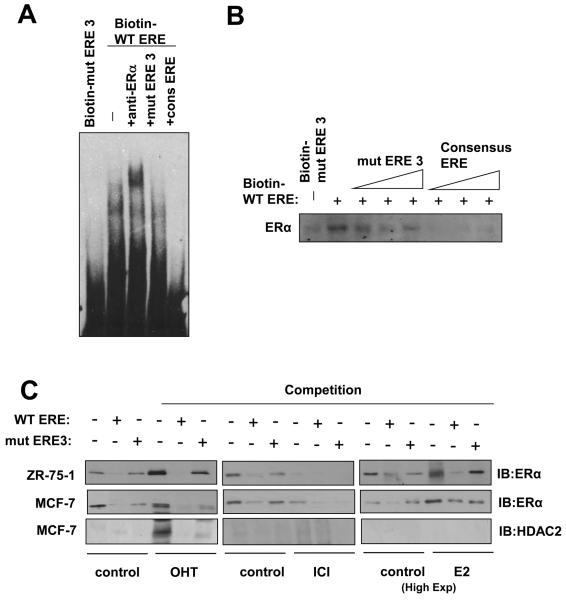
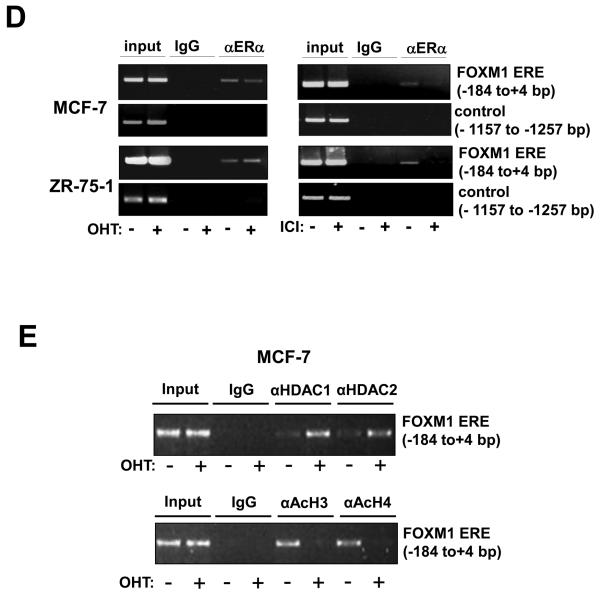
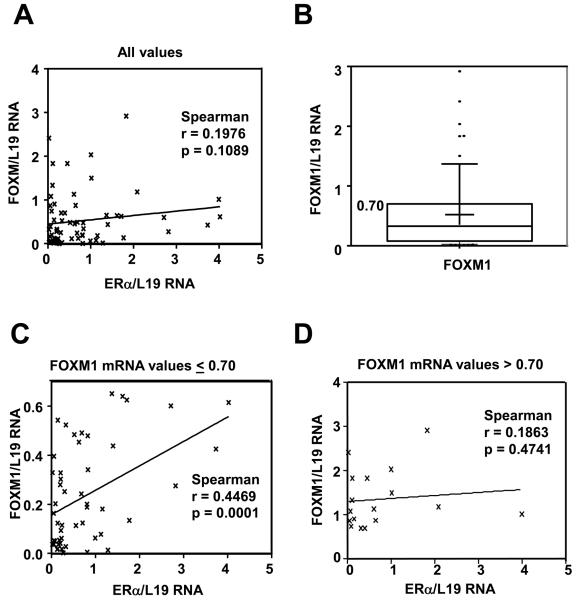
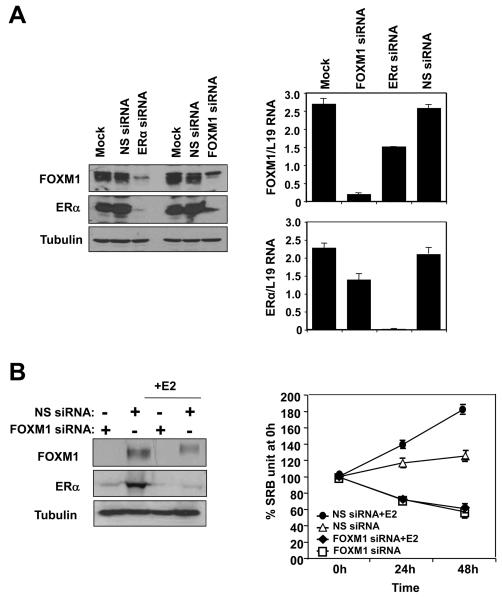
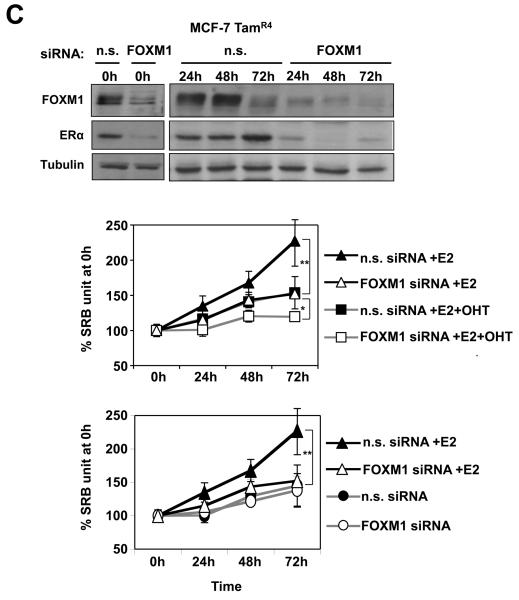
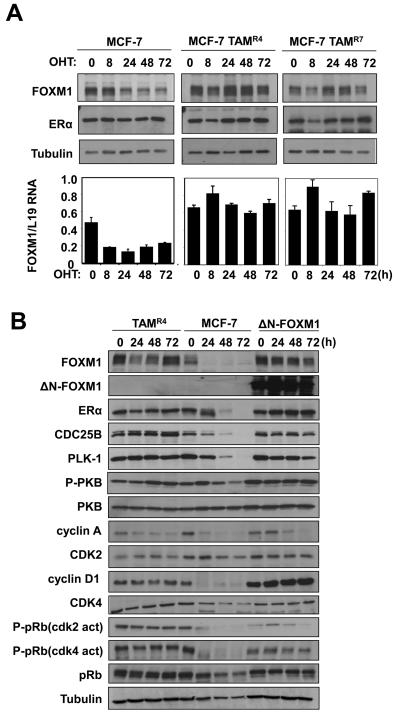
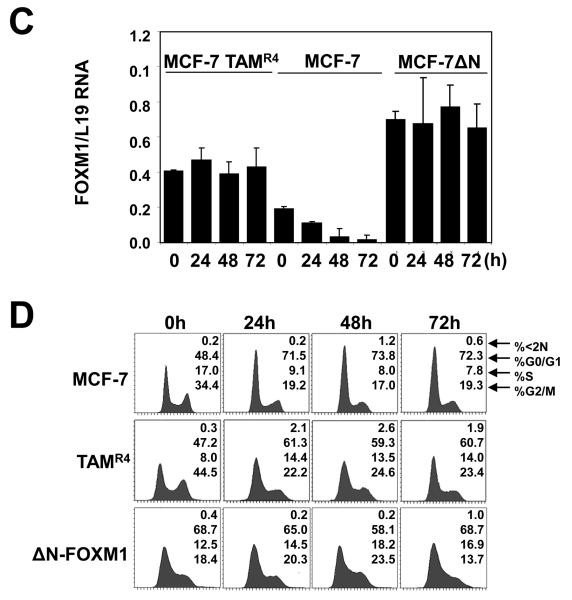
In this study, we investigated the regulation of FOXM1 expression by estrogen receptor alpha (ERalpha) and its role in hormonal therapy and endocrine resistance. FOXM1 protein and mRNA expression was regulated by ER-ligands, including estrogen, tamoxifen (OHT) and fulvestrant (ICI182780; ICI) in breast carcinoma cell lines. Depletion of ERalpha by RNA interference (RNAi) in MCF-7 cells downregulated FOXM1 expression. Reporter gene assays showed that ERalpha activates FOXM1 transcription through an estrogen-response element (ERE) located within the proximal promoter region. The direct binding of ERalpha to the FOXM1 promoter was confirmed in vitro by mobility shift and DNA pull-down assays and in vivo by chromatin immunoprecipitation (ChIP) analysis. Our data also revealed that upon OHT treatment ERalpha recruits histone deacetylases to the ERE site of the FOXM1 promoter, which is associated with a decrease in histone acetylation and transcription activity. Importantly, silencing of FOXM1 by RNAi abolished estrogen-induced MCF-7 cell proliferation and overcame acquired tamoxifen resistance. Conversely, ectopic expression of FOXM1 abrogated the cell cycle arrest mediated by the anti-estrogen OHT. OHT repressed FOXM1 expression in endocrine sensitive but not resistant breast carcinoma cell lines. Furthermore, qRT-PCR analysis of breast cancer patient samples revealed that there was a strong and significant positive correlation between ERalpha and FOXM1 mRNA expression. Collectively, these results show FOXM1 to be a key mediator of the mitogenic functions of ERalpha and estrogen in breast cancer cells, and also suggest that the deregulation of FOXM1 may contribute to anti-estrogen insensitivity.


Figures

Figure 1
Figure 1. Expression of FOXM1 and ERα in response to E2, OHT and ICI treatments in breast cancer cell lines
ZR-75-1, MCF-7 and MDA-MB-231 cells were cultured in 5% double-charcoal striped FCS and phenol red free medium for 24h before stimulated with E2. Breast cancer cells cultured in 10% FCS and phenol red medium were also treated with OHT or ICI. At times indicated, cells were collected and analysed for FOXM1, ERα and tubulin expression by western blotting. FOXM1 mRNA levels of these cells were also analysed by qRT-PCR,, and normalized with L19 RNA expression. Total RNA (2 μg) isolated using the RNeasy Mini kit (Qiagen, Crawley, UK) was reverse transcribed using the Superscript III reverse transcriptase and random primers (Invitrogen, Paisley, UK), and the resulting first strand cDNA was used as template in the real-time PCR. All experiments were performed in triplicate. The following gene-specific primer pairs were designed using the ABI Primer Express software: FOXM1-sense: 5′-TGCAGCTAGGGATGTGAATCTTC-3′ and FOXM1-antisense: 5′-GGAGCCCAGTCCATCAGAACT-3′; ERα-sense: 5′-CAGATGGTCAGTGCCTTGTTGG-3′ and ERα-antisense: 5′-CCAAGAGCAAGTTAGGAGCAAACAG-3′; L19-sense 5′-GCGGAAGGGTACAGCCAAT-3′ and L19-antisense 5′-GCAGCCGGCGCAAA-3′. Specificity of each primer was determined using NCBI BLAST module. Real time PCR was performed with ABI PRISM 7700 Sequence Detection System using SYBR Green Mastermix (Applied Biosystems, Brackley, UK). The qRT-PCR results shown are representative of 3 independent experiments.
Figure 2
Figure 2. ERα induces the transcriptional activity of the human FOXM1 gene through a ERE consensus proximal to the transcription start site
A) Effect of treatment with E2 and expression of ER on FOXM1 promoter activity. Schematic representation of the full-length, HindIII and ApaI FOXM1-luciferase reporter constructs. In upper panel, COS-1 cells cultured in 5% double-charcoal striped FCS and phenol red free medium were transiently transfected with 20 ng of either the empty pGL3-basic, pGL3-FOXM1(Trident), pGL3-FOXM1(ApaI), or the control pGL3-ERE-pS2 promoter/reporter and 0 ng or 10 ng of ERα expression vector (pHEGO) in the absence or presence of E2 and with OHT treatment in the presence of E2 induction (E2+OHT). Cells were harvested 24 h after transfection and assayed for luciferase activity. All relative luciferase activity values are corrected for cotransfected Renilla activity. All data shown represent the averages of data from three independent experiments, and the error bars show the standard deviations. In lower panel, COS-1 cells were transfected with pGL3-FOXM1(Trident), pGL3-FOXM1(ApaI), or pGL3-ERE promoter/reporter constructs, together with increasing amounts (0, 0.1, 1, 10, and 20 ng) of ERα expression vector (pHEGO), and processed as described above. B) Schematic representation of the ApaI FOXM1-luciferase reporter construct, showing the consensus, the wild-type, and the mutant ERE (mERE) sequences. COS-1 cells were transfected with pGL3-basic, pGL3-FOXM1(ApaI) wild-type (WT) or mutant ERE, or the control pGL3-ERE-PS2 promoter/reporter and with or without E2 treatment and 20 ng of ERα expression vector. The transfected cells were processed and assayed as described above.
Figure 3
Figure 3. ERα binds directly to the ERE on the FOXM1 promoter
A) Biotinylated wild-type ERE or the mutant ERE3 oligonucleotides were incubated with MCF-7 cell lysates in the presence or absence of 10x molar excess of non-biotinylated ERE3 or consensus ERE oligonucleotides or an anti-ERα antibody. In brief, gel shift assays (20μl total volume) contained 3μg nuclear extracts and 50ng/μl poly (dI-dC) in 1x binding buffer and 20pmol unlabelled oligonucleotides. For the supershifts, 1μl of the anti-ERα (Santa Cruz; H222) antibody were included in the reaction mix. The mixtures were pre-incubated at room temperature for 15 min, followed by addition of 100fmol of biotin-labelled double stranded estrogen response element (ERE-conc. 5′-GCCGATTGGCGACGTTCGGTCACGCTGACCTTAACGCTCCGCCGGCG-3′ 5′-CGCCGGCGGAGCGTTAAGGTCACGCTGACCGAACGTCGCCAATCGGC-3′), (ERE-wt 5′-GCCGATTGGCGACGTTCCGTCACGTGACCTTAACGCTCCGCCGGCG-3′, 5′-CGCCGGCGGAGCGTTAAGGTCACGTGACGGAACGTCGCCAATCGGC-3′), or (mERE3 5′-GCCGATTGGCGACGTTCCGTAACGTTACGTTAACGCTCCGCCGGC-3′, 5′-CGCCGGCGGAGCGTTAACGTAACGTTACGGAACGTCGCCAATCGGC-3′), and incubation at room temperature for 20 min, followed by a 30 min incubation on ice. Protein-DNA complexes were separated on 5% 0.5 × TBE polyacrylamide gels. The electrophoretic transfer of the binding reactions to the nylon membrane, and the detection of the biotin labelled DNA by chemiluminescence, were performed according to the PIERCE kit's protocols. B) Nuclear extracts from MCF-7 cells were incubated with biotinylated oligonucleotides representing region of the FOXM1 promoter containing the ERE or the mutated ERE3 site in the absence or presence of molar excess of non-biotinylated ERE3 or consensus ERE oligonucleotides. Proteins binding to the biotinylated oligonucleotides were pulled-down using streptavidine agarose beads and analysed by western blot using specific antibodies as indicated. C) The nuclear extracts (Fig. S1) from MCF-7 and ZR-75-1 cells with or without OHT or ICI for 24 h were also examined by pull-down assays using biotinylated wild-type or mutant (mERE3) oligonucleotides as described above. D) Chromatin immunoprecipitation (ChIP) analysis of the human FOXM1 promoter. MCF-7 and ZR-75-1 cells untreated or treated with ICI or OHT for 24 h were used for ChIP assays using IgG, anti-ERα antibodies as indicated. After crosslink reversal, the co-immunoprecipitated DNA was amplified by PCR using primers amplifying the FOXM1 ERE containing region (−184/+4) and a control region (−1157/−1257), and resolved in 2% agarose gel. E) MCF-7 untreated or treated with OHT for 24 h were used for ChIP assays using IgG, antibodies against acetylated H3 and H4, HDAC1 and HDAC2 as described above. Representative data from three independent experiments are shown.
Figure 4
Figure 4. Significant correlation between ERα and FOXM1 expression in human breast samples
Expression of ERα mRNA and FOXM1 mRNA in non-cancerous breast biopsies and malignant breast epithelial tissues. RNA was isolated from epithelial cells purified from normal breast tissues and primary tumours and subjected to qRT-PCR with FOXM1, ERα and L19 primers. A) Graph shows the FOXM1 and ERα mRNA levels of the tumour samples after normalisation with L19 RNA levels. No significant correlation is seen using Pearson correlation when considering all values (n=69; Spearman r=0.198; p=0.109). Significance is defined as p<0.05. Line is linear regression, shown for illustrative purposes. B) Box and whisker plot showing the distribution of values for FOXM1. Box edges represent 25th and 75th percentiles; middle line is the median, while plus shows the mean. The whiskers represent the 10th and 90th percentiles, while outliers are shown as dots. The 75th percentile for FOXM1 mRNA values is 0.7002. C) The right-hand graph shows the FOXM1 and ERα mRNA levels of the tumour samples with FOXM1/L19 mRNA levels below the upper quartile. Correlation analysis was performed between FOXM1 and ERα mRNA. A significant and positive association was found between FOXM1 and ERα mRNA levels in breast patient samples with FOXM1 mRNA level below the upper quartile (n=52; Spearman r=0.447; p=0.0001). P < 0.05 was considered statistically significant. D) The lower left-hand graph shows the FOXM1 and ERα mRNA levels of the tumour samples with FOXM1/L19 mRNA levels in the upper quartile (0.7) of high levels of FOXM mRNA expression. No significant correlation is found using Pearson correlation (n=17; Spearman r=0.186; p=0.474). Significance is defined as p≤0.05.
Figure 5
Figure 5. Effects of ERα and FOXM1 silencing on the expression of FOXM1 and response to E2 induction in MCF-7 cells
A) MCF-7 cells were transiently transfected with ERα, FOXM1 or control smart pool siRNA, and 72 h after transfection cells were analysed by western blot using specific antibodies as indicated and by qRT-PCR. B) MCF-7 cells were transiently transfected with smart pool siRNA against FOXM1, incubated with E2 and analysed by western blotting. SRB assays were also performed on these cells, indicating that the knockdown of FOXM1 decreases the cell proliferation rate and renders MCF-7 cells unresponsive to E2 stimulation. C) OHT-resistant TAMR4 MCF-7 cells were transiently transfected with smart pool siRNA against FOXM1 or control siRNA pool (non-specific/n.s. siRNA) and analysed by western blotting (upper panel). These transfected cells were incubated with or without E2 (middle panel), and with or without OHT in the presence of E2 (lower panel). SRB assays were performed on these cells, indicating that the knockdown of FOXM1 sensitizes the resistant TAMR4 MCF-7 cells to OHT and diminishes their responsiveness to E2 stimulation. Statistical analysis was performed on the proliferation results at 72 h. ** denotes very significant, P<0.01 and * significant, P<0.05. The results show mean+SEM of triplicate measurements.
Figure 6
Figure 6. Expression of FOXM1 and cell cycle regulation in wild-type, OHT-resistant, and constitutively active ΔN-FOXM1 expressing MCF-7 cells in response to OHT treatment
A) MCF-7 and the resistant MCF-7-TAMR4 and -TAMR7 lines cultured in 10% FCS and phenol red medium were treated with OHT in a time course of 72 h. Cell lysates were prepared at the times indicated, and the expression of FOXM1, ERα and tubulin was analyzed by Western blotting. B) MCF-7, MCF-7 TAMR4 and MCF-7 ΔN-FOXM1 cells were treated with OHT in a time course of 72 h. Cell lysates were prepared at the times indicated, and the expression of FOXM1, ERα, CDC25B, P-PKB, total PKB and Tubulin was analyzed by Western blotting. C) FOXM1 mRNA levels of these cells were also analysed by qRT-PCR and normalized to L19 RNA expression. D) Cells were fixed at 0, 24, 48, and 72 h after treatment, and cell cycle phase distribution was analyzed by flow cytometry after propidium iodide staining. Percentage of cells in each phase of the cell cycle (sub-G1, G1, S, and G2/M) is indicated. Representative data from three independent experiments are shown.

Similar articles

Cited by

References

    1. Ali S, Coombes RC. Endocrine-responsive breast cancer and strategies for combating resistance. Nat Rev Cancer. 2002;2:101–12. - PubMed
    1. Bourdeau V, Deschenes J, Metivier R, Nagai Y, Nguyen D, Bretschneider N, et al. Genome-wide identification of high-affinity estrogen response elements in human and mouse. Mol Endocrinol. 2004;18:1411–27. - PubMed
    1. Brunner N, Zugmaier G, Bano M, Ennis BW, Clarke R, Cullen KJ, et al. Endocrine therapy of human breast cancer cells: the role of secreted polypeptide growth factors. Cancer Cells. 1989;1:81–6. - PubMed
    1. Butt AJ, McNeil CM, Musgrove EA, Sutherland RL. Downstream targets of growth factor and oestrogen signalling and endocrine resistance: the potential roles of c-Myc, cyclin D1 and cyclin E. Endocr Relat Cancer. 2005;12(Suppl 1):S47–59. - PubMed
    1. Carroll JS, Brown M. Estrogen receptor target gene: an evolving concept. Mol Endocrinol. 2006;20:1707–14. - PubMed

Publication types

MeSH terms