. 2010 Mar 4;5(3):e9519.
doi: 10.1371/journal.pone.0009519.

Differentiation of symbiotic cells and endosymbionts in Medicago truncatula nodulation are coupled to two transcriptome-switches

Affiliations

Differentiation of symbiotic cells and endosymbionts in Medicago truncatula nodulation are coupled to two transcriptome-switches

Nicolas Maunoury et al. PLoS One. .

Abstract

The legume plant Medicago truncatula establishes a symbiosis with the nitrogen-fixing bacterium Sinorhizobium meliloti which takes place in root nodules. The formation of nodules employs a complex developmental program involving organogenesis, specific cellular differentiation of the host cells and the endosymbiotic bacteria, called bacteroids, as well as the specific activation of a large number of plant genes. By using a collection of plant and bacterial mutants inducing non-functional, Fix(-) nodules, we studied the differentiation processes of the symbiotic partners together with the nodule transcriptome, with the aim of unravelling links between cell differentiation and transcriptome activation. Two waves of transcriptional reprogramming involving the repression and the massive induction of hundreds of genes were observed during wild-type nodule formation. The dominant features of this "nodule-specific transcriptome" were the repression of plant defense-related genes, the transient activation of cell cycle and protein synthesis genes at the early stage of nodule development and the activation of the secretory pathway along with a large number of transmembrane and secretory proteins or peptides throughout organogenesis. The fifteen plant and bacterial mutants that were analyzed fell into four major categories. Members of the first category of mutants formed non-functional nodules although they had differentiated nodule cells and bacteroids. This group passed the two transcriptome switch-points similarly to the wild type. The second category, which formed nodules in which the plant cells were differentiated and infected but the bacteroids did not differentiate, passed the first transcriptome switch but not the second one. Nodules in the third category contained infection threads but were devoid of differentiated symbiotic cells and displayed a root-like transcriptome. Nodules in the fourth category were free of bacteria, devoid of differentiated symbiotic cells and also displayed a root-like transcriptome. A correlation thus exists between the differentiation of symbiotic nodule cells and the first wave of nodule specific gene activation and between differentiation of rhizobia to bacteroids and the second transcriptome wave in nodules. The differentiation of symbiotic cells and of bacteroids may therefore constitute signals for the execution of these transcriptome-switches.


Conflict of interest statement

Competing Interests: The authors have declared that no competing interests exist.

Figures

Figure 1
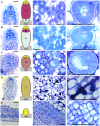
Figure 1. Nodule structure and infection in wild type and Fix mutants.
Semi-thin longitudinal nodule sections were stained with toluidine blue and observed by light microscopy. (A) J5-Sm1021 Wild type; (B) TRV43-Sm1021; (C) J5-Sm1021bacA; (D) TR3-Sm1021; (E) V1-Sm1021. (Left panels) Tissue organisation of nodules including a corresponding schematic illustration. Tissues distinguishable in the nodule are I, meristem; I* in (E), primordium-like structure with dividing cells; II, infection and differentiation zone; II* in (D), zone of infection without cellular differentiation; III, nitrogen fixation zone; III* in (B), zone with fully differentiated cells that, however, do not fix nitrogen; III** in (C), zone with differentiated plant cells in which bacteroids are not differentiated; IV, zone of symbiotic cell senescence; root and nodule cortical tissues are in grey. Bars equal 200 µm. (Middle panels) Enlargement of the central area of the nodules showing the presence or absence of differentiated symbiotic cells. Bars equal 50 µm. (Right panels) Images of symbiotic cells showing the structure of the intracellular bacteria (A–C) or the absence of differentiation and bacteria in the cells in the central area of the nodule (D,E). Bars equal 50 µm.
Figure 2
Figure 2. Ploidy levels in nodule cells as determined by flow cytometry.
(A,B) Measurement of the DNA content in the nuclei of roots (A) and in wild type nodules (B). The x-axis is DAPI fluorescence (DNA content) and the y-axis is the number of counts (amount of nuclei). The peaks at 2C, 4C, 8C, 16C, 32C and 64C are indicated with arrowheads. (C) Arborescence of the hierarchical cluster analysis of the data in (D). (D) Heat map for the hierarchical cluster analysis of the ploidy levels in the nodules of the mutants used in this study. The columns correspond to the type of nuclei at 2C, 4C, 8C, 16C, 32C and 64C. The colour code is red, high, black, intermediate and green, low relative amounts of nuclei expressed in %. Each row corresponds to a nodule or a root sample. The identity of the samples is indicated at the right of the heat map. (E) Endoreduplication index expressing the relative amounts of 16C, 32C and 64C nuclei in nodules. The identity of the samples is as in (D).
Figure 3
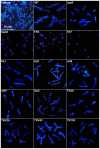
Figure 3. Differentiation of bacteroids in nodules.
Bacteroids were isolated from wild type and mutant nodules, stained with DAPI and visualized with fluorescence microscopy. The scale bar is the same for all panels.
Figure 4
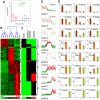
Figure 4. The transcriptome of wild type M. truncatula nodules.
(A) PCA analysis of microarray experiments. The two principal components and their fraction of the overall variability of the data (%) are shown on the x-axis and the y-axis. Clusters of experiments are circled and annotated as “roots”, containing time points 0, 2, 4, 6 dpi, “incipient nodules”, containing time points 7, 8, 10 dpi and “nodules”, containing time points 13, 20 and 29 dpi. (B) Heat map of the hierarchical cluster analysis of the microarray hybridization experiments. The columns correspond to the different time points indicated above the map and the arborescence indicates the similarity among transcriptomes. Below the heat map is a colour coded scale bar for the relative expression levels of genes. (C) Heat map of the levels of expression converted to integer values (1, 2 or 3 as indicated in the colour coded scale bar below the heat map) which indicate statistical differences (p<0.01) and gene expression strength in numerical order. (D) Expression profiles for all the genes in the profile measured by microarray analysis. The order of the points in the curves is 0, 2, 4, 6, 7, 8, 10, 13, 20 and 29 dpi. The same colour code as in (B) is used. (E) RT-qPCR measurements of expression patterns for 3 selected genes from each expression profile. The histograms are organized in one row per profile and annotated with the MtGI accession numbers. The relative expression levels, which correspond to the fold change relative to the sample with the lowest value (arbitrarily set to 1), are shown for R108 roots, 1 (brown bars), immature nodules, induced by Sm41, at 8 dpi, 2 (orange bars) and mature nodules at 15 dpi, 3 (green bars). The error bars correspond to the standard deviations for 3 biological repetitions.
Figure 5
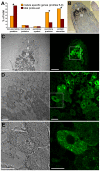
Figure 5. The secretory pathway is strongly activated in nodule zones II and III.
(A) Distribution of genes exhibiting expression profiles 5–8 (321 genes) and the total probe-set (2366 genes) into categories of the secretory pathway. A significant enrichment or depletion of categories, supported by Fisher's exact test, is indicated by an asterisk (*). The p-values are 10−42 for the category “non-secretory proteins”, 10−52 for the category “secretory proteins” and 10−42 for the category “protein secretion” (combined categories “membrane proteins”, “secretory system” and “secretory proteins”). (B) In situ hybridization with an antisense probe of the SPP gene. The position of nodule zones I, II and III are indicated. SPP expression is observed as a black signal in the proximal zone II. The inset shows a control hybridization with a sense probe. (C–E) Immunolocalization of the ER specific KDEL marker MAC 256. On the left are the DIC images and on the right are the fluorescence images. (D) is a magnification of the region outlined in (C). (E) is an enlargement of the region outlined in (D). Scale bars are 100 µm (B,C), 20 µm (D) and 10 µm (E).
Figure 6
Figure 6. The transcriptome in non-functional, Fix nodules of M. truncatula.
(A) PCA analysis of the microarray experiments. The two principal components and their fraction of the overall variability of the data (%) are shown on the x-axis and on the y-axis. Clusters of experiments are circled and annotated as “roots”, containing root samples and nodules from mutants Sm2011exoY, Sm1021bacA, TR3, TE7 and V1; “incipient nodules” containing wild type immature nodules; and “nodules” containing wild type nodules and nodules from the M. truncatula mutants TR183, TR36, TRV36, TRV43 and the S. meliloti mutants lpsB, nifA, fixJ, fixK, fixG and nifH. (B) Heat map of transcriptomes of nodulation mutants. The samples are annotated above the columns. The arborescence above the columns shows the similarities among the transcriptomes. The gene expression profiles that were identified in the wild type temporal analysis (see Figure 4) are indicated at the left. The colour coded scale bar for the relative levels of expression of the genes is indicated below the heat map. (C) RT-qPCR analysis of the expression patterns for 3 genes, selected among the ensemble, which exhibit expression profiles 5, 6, 7 and 8 and for genes expressed in all the mutants (common genes). The histograms are annotated with MtGI accession numbers. The samples in the histograms are as follows: J5 wild type roots, 1 (brown bars); nodules from TR3 induced by Sm1021, 2, and from TE7 induced by Sm1021, 3, (orange bars); nodules from J5 induced by Sm1021bacA, 4, (red bars); and nodules from TR36 induced by Sm1021, 5, and J5 wild type nodules induced by Sm1021, 6 (green bars). The relative expression levels correspond to the fold change relative to the sample with the lowest value (arbitrarily set to 1). The error bars correspond to the standard deviations for 3 biological repetitions.
Figure 7
Figure 7. Two transcriptome-switches in nodule formation.
Progenitor cells (yellow) in the primordium or meristem differentiate to large, endoreduplicated and infected symbiotic cells (red) thus activating the first transcriptome-switch. The V1, exoY, TR3 and TE7 mutants are blocked before this point. The rhizobia in symbiotic cells (blue) differentiate to large, endoreduplicated bacteroids (green) activating the second transcriptome-switch. The bacA mutant is blocked before this point but after the first switch. The mutants TR36, TR183, TRV36, TRV43, nifH, nifA, fixG, fixJ, fixK and lpsB pass, similarly to the WT, the second switch.

Similar articles

Cited by

References

    1. Jones KM, Kobayashi H, Davies BW, Taga ME, Walker GC. How rhizobial symbionts invade plants: the Sinorhizobium-Medicago model. Nat Rev Microbiol. 2007;5:619–633. - PMC - PubMed
    1. Maunoury N, Kondorosi A, Kondorosi E, Mergaert P. James EK, Sprent JI, Dilworth WE, Newton WE, editors. Cell biology of nodule infection and development. 2008. pp. 153–189. Nitrogen-fixing Leguminous Symbioses: Springer.
    1. Van de Velde W, Guerra JCP, De Keyser A, De Rycke R, Rombauts S, et al. Aging in legume symbiosis. A molecular view on nodule senescence in Medicago truncatula. Plant Physiol. 2006;141:711–720. - PMC - PubMed
    1. Cebolla A, Vinardell JM, Kiss E, Olah B, Roudier F, et al. The mitotic inhibitor ccs52 is required for endoreduplication and ploidy-dependent cell enlargement in plants. EMBO J. 1999;18:4476–4484. - PMC - PubMed
    1. Vinardell JM, Fedorova E, Cebolla A, Kevei Z, Horvath G, et al. Endoreduplication mediated by the anaphase-promoting complex activator CCS52A is required for symbiotic cell differentiation in Medicago truncatula nodules. Plant Cell. 2003;15:2093–2105. - PMC - PubMed

Publication types