. 2010 Mar 4;5(3):e9537.
doi: 10.1371/journal.pone.0009537.

Scyl1 regulates Golgi morphology

Affiliations

Scyl1 regulates Golgi morphology

Jonathon L Burman et al. PLoS One. .

Abstract

Background: Membrane trafficking is a defining feature of eukaryotic cells, and is essential for the maintenance of organelle homeostasis and identity. We previously identified Scy1-like 1 (Scyl1), a member of the Scy1-like family of catalytically inactive protein kinases, as a high-affinity binding partner of COPI coats. COPI-coated vesicles control Golgi to endoplasmic reticulum trafficking and we observed that disruption of Scyl1 function leads to a decrease in trafficking of the KDEL receptor via the COPI pathway. We reasoned that if Scyl1 plays a major role in COPI trafficking its disruption could influence Golgi homeostasis.

Methodology/principal findings: We performed Scyl1 knock down in cultured cells using previously established methods and observed an alteration in Golgi morphology. Both the surface area and volume of the Golgi is increased in Scyl1-depleted cells, but the continuity and polarity of the organelle is unperturbed. At the ultrastructural level we observe a decrease in the orderly structure of the Golgi with an increase in cisternal luminal width, while the number of Golgi cisternae remains unchanged. The golgin family of proteins forms a detergent resistant network that controls Golgi homeostasis. Disruption of this protein network by knock down of the golgin p115 disrupts the Golgi localization of Scyl1. Moreover, we find that Scyl1 interacts with 58K/formiminotransferase cyclodeaminase (FTCD), a protein that is tightly associated with the cis face of the Golgi.

Conclusions/significance: Our results place Scyl1 at an interface between the golgin network and COPI trafficking and demonstrate that Scyl1 is required for the maintenance of Golgi morphology. Coupled with the observation from others that Scyl1 is the gene product responsible for the neurodegenerative mouse model mdf, our results additionally implicate the regulation of COPI trafficking and Golgi homeostasis in neurodegeneration.


Conflict of interest statement

Competing Interests: The authors have declared that no competing interests exist.

Figures

Figure 1
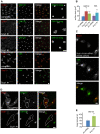
Figure 1. Expansion of the Golgi following Scyl1 knock down.
A, HeLa cells were transfected with control (ctrl) siRNA or one of two previously characterized siRNAs (Scyl1 #1 and #2) specific for Scyl1 . The cells were subsequently fixed and processed for indirect immunofluorescence with antibodies against Scyl1 (red) and either GM130 or 58K (green). Magnified views of regions of the GM130 staining are shown in the rightmost 3 panels. The scale bars = 10 µm. B, The two-dimensional surface area was calculated for a large number of Golgi as described under Materials and Methods. Despite variability in Golgi size as indicated by the overlapping error bars, which indicate standard error of the mean, Scyl1 knock down causes a significant increase in the surface area of the Golgi (*** p<0.001) as determined by a Student's t-test. C, Cells treated with ctrl siRNA or Scyl1 #1 siRNA were subsequently mixed and co-stained for Scyl1 (red) and 58K (green). The two cells in the middle, lacking Scyl1 expression have expanded Golgis. The scale bar = 10 µm. D, HeLa cells, transfected with control siRNA or Scyl1 #1 siRNA were subsequently fixed and processed for indirect immunofluorescence with antibodies against Scyl1 (red) and GM130 (green). Outlines of the cells are indicated. The scale bar = 10 µm. E, The two-dimensional surface area of the Golgi was calculated and presented as a percentage of the two-dimensional whole cell area. The Golgi in Scyl1 knock down cells covers a significantly (*** p<0.001, Student's t-test) larger area of the cell. Error bars represent standard error of the mean for all graphs.
Figure 2
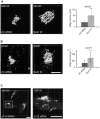
Figure 2. The volume of the Golgi is increased following Scyl1 knock down.
A, HeLa cells transfected with control (ctrl) or Scyl1 #1 siRNA were stained for GM130. Z-series of complete Golgi stacks were imaged by confocal microscopy and volume surface rendered using Imaris software as described in Materials and Methods. The scale bar = 10 µm. The volume of the Golgi labelled with antibody against GM130 was determined as described in Materials and Methods. A significant increase (*** p<0.001; Student's t-test) in Golgi volume was seen, as indicated graphically on the right. B, HeLa cells transfected with control or Scyl1 siRNA were stained for βCOP and processed as described in A. C, HeLa cells transfected with p115 siRNA were stained for GM130. Z-series of complete Golgi stacks were imaged by confocal microscopy and volume surface rendered using Imaris software. The scale bar = 10 µm. Error bars represent standard deviation.
Figure 3
Figure 3. The expanded Golgi remains intact.
A, HeLa cells transfected with control (ctrl) or Scyl1 miRNA and MannII-GFP were subjected to FRAP and FLIP analysis as described in the Materials and Methods. The images reveal MannII-GFP fluorescence with boxes indicating the photobleached areas. Images were collected prior to bleaching (pre), immediately after the first bleach (0) or at the indicated times (in seconds) after bleaching. Scale bars = 10 µm. B, The normalized intensity of fluorescence staining over the course of the FLIP and FRAP experiments. For the FLIP experiments (top graph) the y-axis value reflects the % GFP intensity normalized to the zero time fluorescence intensity prior to the repeated photobleachings during FLIP. Error bars are standard error of the mean (N = 9 for ctrl miRNA; N = 7 for unbleached Golgis and N = 6 for Scyl1 miRNA). No significant difference in the FLIP of Mannosidase II-GFP was observed between ctrl and Scyl1 miRNA expressing cells. For the FRAP experiments (bottom graph) the y-axis = the Golgi fluorescence intensity over the cytosolic fluorescence intensity during FRAP. There was no significance difference in the half maximal recovery time of Mannosidase II in either control of KD conditions. However, p115 KD eliminated Mannosidase II recovery by fragmenting the Golgi. Error bars represent standard error of the mean (ctrl miRNA N = 12; Scyl1 miRNA N = 9; p115 siRNA N = 8).
Figure 4
Figure 4. The expanded Golgi remains polarized.
HeLa cells were transfected with control (ctrl) or Scyl1 inhibitory miRNAs that were driven from a plasmid that also expresses emGFP. The cells were subsequently fixed and processed for indirect immunofluorescence with antibodies against TGN46 (red) and GM130 (blue). The box in the left panels indicates the expanded area shown in the right panels. The scale bar = 10 µm for the left and 4 µm for the right images, respectively.
Figure 5
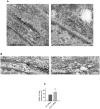
Figure 5. EM analysis of Golgi ultrastructure.
A/B, HeLa cells were treated with control (ctrl) or Scyl1 siRNA and were then processed for EM analysis. Images show representative Golgi stacks at 26,000X (A) and 43,000X (B). C, The luminal width of the Golgi stacks was quantified.
Figure 6
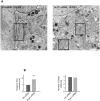
Figure 6. EM analysis of Golgi localization.
A, HeLa cells were treated with control or Scyl1 siRNA and were then processed for EM analysis. Images show representative cells at 16,000X with the Golgi stacks indicated by black boxes. B, The average distance of a Golgi stack from the nucleus and the number of Golgi cisternae were quantified.
Figure 7
Figure 7. Scyl1 has several properties of golgins.
A, P3 microsomes, enriched in Golgi membranes, were prepared from brain extracts and were resuspended in 10 mM HEPES, pH 7.4 or the same buffer containing 150 mM NaCl or 1% Triton X-100, or in Na-carbonate buffer at pH 11. The samples were then spun at high g and the supernatant (S) and pellet (P) fractions were analyzed by Western blot with the indicated antibodies. B, GFP-Scyl1 was transfected into HeLa cells and the Golgi area was bleached. The recovery of fluorescence on the Golgi was recorded over time.
Figure 8
Figure 8. Scyl1 binds 58K.
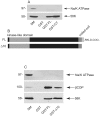
A, GST-tagged full-length Scyl1 (GST-FL) or the isolated C-terminal region (GST-CT), along with GST alone were incubated with rat liver extracts and specifically bound proteins were processed for Western blot with antibodies against Na/K ATPase and 58K. B, Schematic representation of Scyl1 full-length (FL) and the full-length protein lacking the last 10 amino acids (Δ10). C, The constructs described in B were used in affinity selection assays followed by Western blot with antibodies for Na/K ATPase, 58K and βCOP. For A and C, starting material (SM) represents 1/20 of the input to the selection experiment.
Figure 9
Figure 9. Disruption of the golgin network displaces Scyl1 from the Golgi.
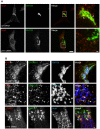
A, HeLa cells were transfected with control or p115 siRNA and were subsequently fixed and processed for indirect immunofluorescence with antibodies against Scyl1 (red) and GM130 (green). The area indicated by the box in the merged image is shown at higher power on the right. Arrowheads indicate co-localizing structures. The scale bar = 10 µm for the low and 1 µm for high power images, respectively. B, HeLa cells were transfected with control or p115 siRNA and with ERGIC53-YFP, and were subsequently fixed and processed for indirect immunofluorescence with antibodies against Scyl1 (red) and GM130 (blue) with ERGIC53 imaged in the green channel; top eight panels or with antibodies against TGN46 (red), GM130 (green) and Scyl1 (blue); bottom 4 panels. For the middle four panels, arrowheads indicate co-localizing structures. For the bottom four panels, arrowheads indicate areas where TGN46 and GM130 are found in close apposition and lack the presence of Scyl1. The scale bar = 1 µm.

References

    1. Kirchhausen T. Three ways to make a vesicle. Nat Rev Mol Cell Biol. 2000;1:187–198. - PubMed
    1. Malsam J, Satoh A, Pelletier L, Warren G. Golgin tethers define subpopulations of COPI vesicles. Science. 2005;307:1095–1098. - PubMed
    1. Guo Y, Linstedt AD. COPII-Golgi protein interactions regulate COPII coat assembly and Golgi size. J Cell Biol. 2006;174:53–63. - PMC - PubMed
    1. Storrie B, Pepperkok R, Nilsson, T Breaking the COPI monopoly on Golgi recycling. Trends Cell Biol. 2000;10:385–391. - PubMed
    1. Short B, Haas A, Barr FA. Golgins and GTPases, giving identity and structure to the Golgi apparatus. Biochim Biophys Acta. 2005;1744:383–395. - PubMed

MeSH terms