. 2010 Mar 4;5(3):e9539.
doi: 10.1371/journal.pone.0009539.

Macrophage dysfunction impairs resolution of inflammation in the wounds of diabetic mice

Affiliations

Macrophage dysfunction impairs resolution of inflammation in the wounds of diabetic mice

Savita Khanna et al. PLoS One. .

Abstract

Background: Chronic inflammation is a characteristic feature of diabetic cutaneous wounds. We sought to delineate novel mechanisms involved in the impairment of resolution of inflammation in diabetic cutaneous wounds. At the wound-site, efficient dead cell clearance (efferocytosis) is a pre-requisite for the timely resolution of inflammation and successful healing.

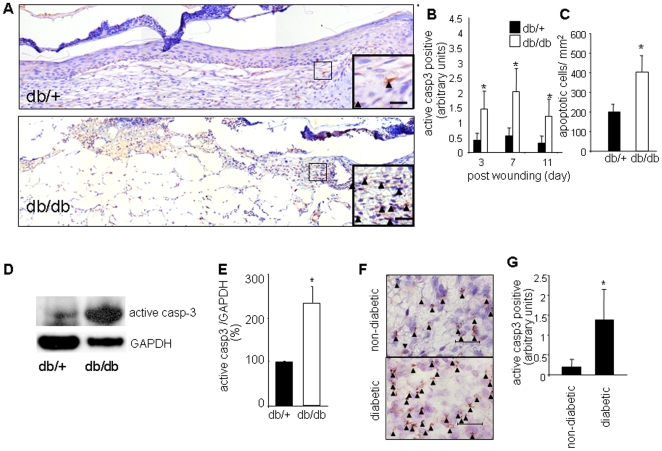
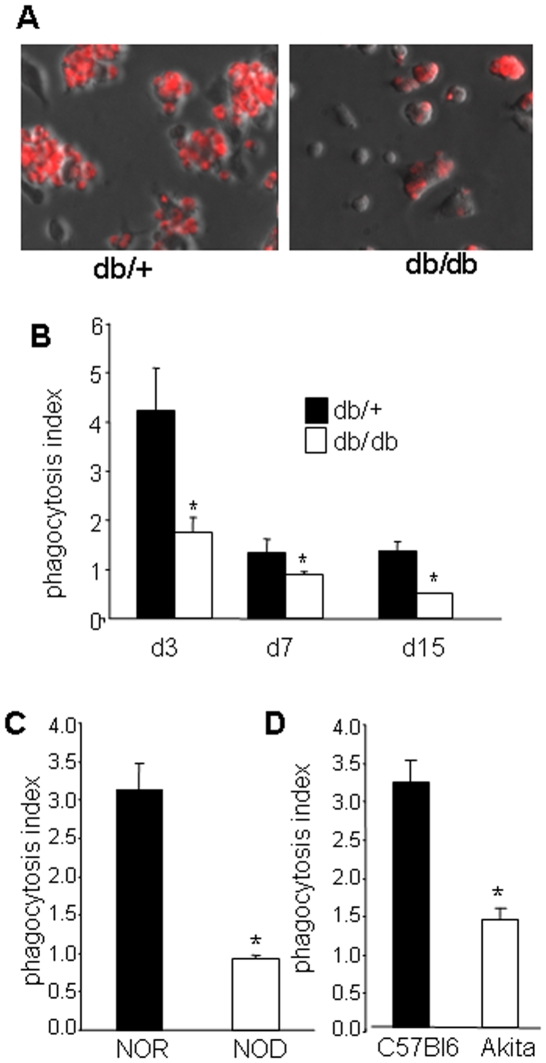
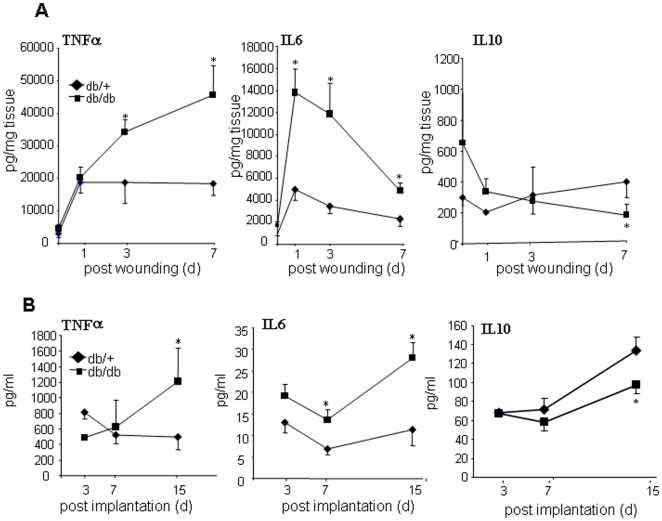
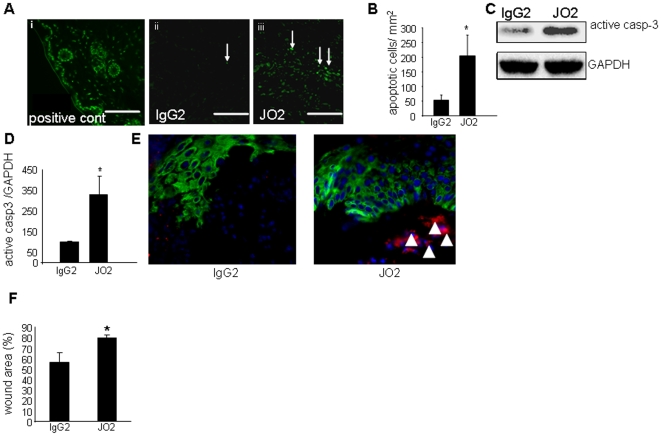
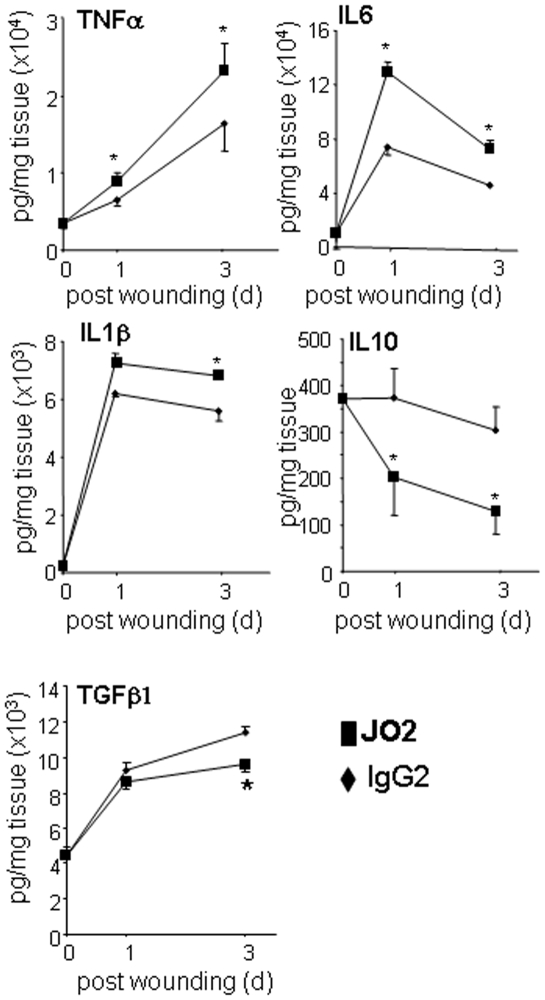
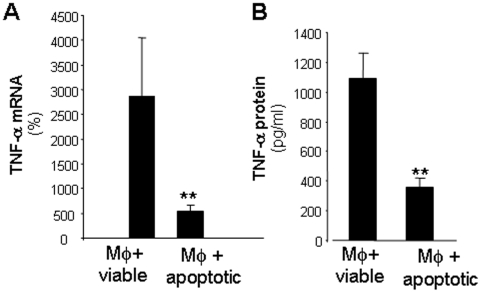
Methodology/principal findings: Macrophages isolated from wounds of diabetic mice showed significant impairment in efferocytosis. Impaired efferocytosis was associated with significantly higher burden of apoptotic cells in wound tissue as well as higher expression of pro-inflammatory and lower expression of anti-inflammatory cytokines. Observations related to apoptotic cell load at the wound site in mice were validated in the wound tissue of diabetic and non-diabetic patients. Forced Fas ligand driven elevation of apoptotic cell burden at the wound site augmented pro-inflammatory and attenuated anti-inflammatory cytokine response. Furthermore, successful efferocytosis switched wound macrophages from pro-inflammatory to an anti-inflammatory mode.

Conclusions/significance: Taken together, this study presents first evidence demonstrating that diabetic wounds suffer from dysfunctional macrophage efferocytosis resulting in increased apoptotic cell burden at the wound site. This burden, in turn, prolongs the inflammatory phase and complicates wound healing.


Conflict of interest statement

Competing Interests: The authors have declared that no competing interests exist.

Figures

Figure 1
Figure 1. Increased number of apoptotic cells in wounds of diabetic mice and humans.
A, Representative mosaic images from day 3 wounds of diabetic (db/db) or non-diabetic (db/+) mice stained with active caspase 3 (brown). Counterstaining was performed using hematoxylin (blue). The mosaic images of whole wounds were collected under 20× magnification guided by MosaiX software (Zeiss) and a motorized stage. Each mosaic image was generated by combining 12–14 images. Inset: higher magnification image of the boxed area marked in the mosaic image. scale bar (inset)  = 10 µm; B–C, quantification of active caspase 3 (B) or TUNEL positive cells (C). Data are shown as mean ± SD (n = 3); *, p<0.05 versus control non diabetic (db/+) mice; D. A representative Western blot image of active caspase-3 (casp-3) and GAPDH (housekeeping) in day3 wound tissue extracts of diabetic (db/db) or non-diabetic (db/+) mice. E. Densitometry data of blot shown in panel D. Data shown are mean ± SD (n = 3). *, p<0.05 compared to db/+ mice; F–G, wound biopsies were obtained from non-diabetic or diabetic patients presented at the wound clinic. Specimens (3 mm punch) were obtained from the edge of wounds immunostained using active caspase 3 (brown) antibody as a marker of apoptotic cells. Counterstaining was performed using hematoxylin (blue); F. microscopic images, arrows indicate positive cells. Scale bar  = 50 µm; G, quantification of active caspase 3 positive areas shown in F. Data shown are mean ± SD (n = 3); * p< 0.05 versus non diabetic leg wounds.
Figure 2
Figure 2. Identification of apoptotic neutrophils and endothelial cells in diabetic wounds.
Representative immunostained section of: A, day 3 wound showing neutrophils (green) and active casp-3 (red) staining; and B, day 7 wound showing endothelial cells (CD31, green) and active casp-3 (red) staining. Nuclear counterstaining was performed using DAPI (blue). i, Low power (20x) images, Scale bar  = 50 µm.; ii-iv, high powered images of the boxed area in i showing active casp-3 (red) and DAPI (blue) (ii) anti-neutrophil or anti-CD31 (green) and DAPI (blue) (iii); and merged images of anti-neutrophil/anti-CD31 and active casp-3. Casp3 positive neutrophils/endothelial cells are shown with white arrows. Scale bar (Aii-iv and Bii-iv)  = 10 µm.
Figure 3
Figure 3. Dead cell clearance by wound-site macrophages.
For dead cell clearance assay, wound macrophages were co-cultured with cell-tracker labeled (red) thymocytes. A, Thymocyte apopotosis detected using Annexin V (FITC conjugated). Annexin V binds to externalized phosphatidyl serine (PS), a characteristics of apoptotic cells. Such treatment resulted in over 90% cells becoming phosphatidylserine (PS) positive. Data are mean ± SD; p<0.05 (n = 4). B, F4/80-FITC (green) and DAPI (blue, nuclear) stained wound macrophage establishing link with an apoptotic thymocyte (red); C, wound macrophage (F4/80-FITC and DAPI stained) engulfed a number of red apoptotic thymocytes; D, co-cultures of control (untreated, viable) thymocytes (red) with wound macrophage (DIC image) followed by wash; E, co-cultures of apoptotic thymocytes (red) with wound macrophages (differential image contrast, DIC image) followed by wash; F–G, Representative high magnification image of a macrophage in DIC (F) or stained with F4/80 FITC (green, G) showing engulfed and adhered (white arrows) apoptotic thymocytes (red). H, scoring of thymocytes engulfed by macrophage. Data are presented as phagocytic index which is defined as total number of apoptotic cells engulfed by macrophages in a field of view divided by total number of macrophage presented in the view. This approach enables normalization of the data against macrophage number. Data presented as mean ± SD (n = 3). *, p<0.01 compared to macrophage co-cultured with control thymocytes.
Figure 4
Figure 4. Dead cell clearance activity is impaired in wound-site macrophages harvested from diabetic mice.
A, representative images of macrophage (phase contrast) from diabetic (db/db) and their matched control non diabetic (db/+) co-cultured with apoptotic thymocytes (red); B–D, quantification of dead cell clearance activity of wound macrophages from three different genetic backgrounds; B, phagocytic index of wound macrophages harvested 3, 7 or 15 day post implantation from db/+ (non-diabetic control) or db/db (type 2 diabetes); C, phagocytic index of wound macrophages harvested day 5 post implantation from NOR (control) or NOD (type 1 diabetes); and D, phagocytic index of wound macrophages harvested day 5 post implantation from Akita (Ins2Akita, type 1 diabetes) & C57Bl6 (non-diabetic controls). Data are mean ±SD (n = 3).*, p<0.05 versus control mice.
Figure 5
Figure 5. Increased pro-inflammatory cytokine levels in diabetic wounds and in wound-site macrophages.
A, Cytokine levels in excisional wound tissue collected on days 1, 3 and 7 post-wounding were measured using ELISA. Data are presented as pg cytokine levels per mg of wet tissue. Mean ± SD (n = 5).*, p<0.05 db/db versus db/+; B, PVA sponges were harvested on days 3, 7 or 15 after implantation and macrophages were isolated. Macrophages (1×10⁶) were seeded in 6-well plates. Cytokine levels in culture media was measured 24 h post-seeding using ELISA. Mean ± SD (n = 4). *, p<0.05 db/db versus db/+.
Figure 6
Figure 6. Topical application of Fas-activating anti-CD95 JO2 to the wound-site increased apoptotic cell count while not inducing apoptosis in keratinocytes.
A, visualization of TUNEL stained apoptotic cells in day 5 wound tissue treated with anti-murine CD95 (clone:JO2, 2 µg/wound) or vehicle containing isotype control (IgG2). Positive control (wound tissue treated with proteinase K and nuclease) showing TUNEL positive apoptotic cells with green nuclei stain; B, scoring of apoptotic cells in wound tissue sections stained with TUNEL. *, p<0.05 compared to the paired vehicle-treated wounds; C, a representative Western blot image of active caspase-3 (casp-3) and GAPDH (housekeeping) in tissue extracts from IgG2 or JO2 treated d3 wounds; D, densitometric data of blot shown in panel C. Data shown are mean ± SD (n = 3). *, p<0.05 compared to IgG2 treated wounds; E, JO2 treatment did not induce keratinocyte apoptosis. Keratin-14 (green), active caspase-3 (red) and DAPI (blue) stained migrating epithelial tip in placebo (left) or JO2 treated (right) wounds. Scale bar  = 20 µm. Active caspase-3 staining was observed in the granulation tissue but not in the hyper-proliferative epithelium or epithelial tip following JO2 treatment; F, wound area as percentage of initial wound determined on the day 3 after wounding. Data are shown as mean ± SD (n = 4).*, p<0.05 versus corresponding control IgG2 treated wound.
Figure 7
Figure 7. Increasing dead cell burden in wounds resulted in increased pro-inflammatory cytokine levels.
Wound tissue treated with anti-CD95 JO2 or control IgG2 were harvested on days 0, 1 and 3 post-wounding. Cytokine levels from paired (control and treated) wound tissue were measured using ELISA on the indicated days post-wounding. Significant increase in pro-inflammatory cytokines (TNFα, IL-6, IL1β) and decrease in levels of anti-inflammatory cytokines IL-10 and TGFβ1 was noted in wounds that had increased apoptotic cell load. Data (mean ±SD, n = 5) are presented as pg cytokine per mg wound tissue. *, p<0.05 compared to IgG treated control side.
Figure 8
Figure 8. Efferocytosis of apoptotic cells by wound macrophages resulted in suppression of pro-inflammatory TNFα gene and protein expression.
Following apoptotic cell clearance assay the non-phagocytosed thymocytes were removed by washing and cells were challenged with LPS (1 µg/ml) and IFNγ (10 ng/ml) for 4 h (gene expression) or 16 h (protein expression). TNFα gene (A) and protein (B) expression were measured using real-time PCR and ELISA, respectively. mRNA expression data are presented as % change compared to LPS+IFNγ non-activated control samples. Protein data is expressed as concentration of TNF-α secreted in culture media. Data are mean ±SD (n = 4); **, p<0.01 compared to macrophage cultured with viable cells.

Similar articles

Cited by

References

    1. Ramsey SD, Newton K, Blough D, McCulloch DK, Sandhu N, et al. Incidence, outcomes, and cost of foot ulcers in patients with diabetes. Diabetes Care. 1999;22:382–387. - PubMed
    1. Brem H, Tomic-Canic M. Cellular and molecular basis of wound healing in diabetes.[comment]. Journal of Clinical Investigation. 2007;117:1219–1222. - PMC - PubMed
    1. Pierce GF. Inflammation in nonhealing diabetic wounds: the space-time continuum does matter.[comment]. American Journal of Pathology. 2001;159:399–403. - PMC - PubMed
    1. Gillitzer R, Goebeler M. Chemokines in cutaneous wound healing. Journal of Leukocyte Biology. 2001;69:513–521. - PubMed
    1. Martin P. Wound healing–aiming for perfect skin regeneration. Science. 1997;276:75–81. - PubMed

Publication types