

Bayesian network expansion identifies new ROS and biofilm regulators
- PMID: 20209085
- PMCID: PMC2831072
- DOI: 10.1371/journal.pone.0009513
Bayesian network expansion identifies new ROS and biofilm regulators
Abstract
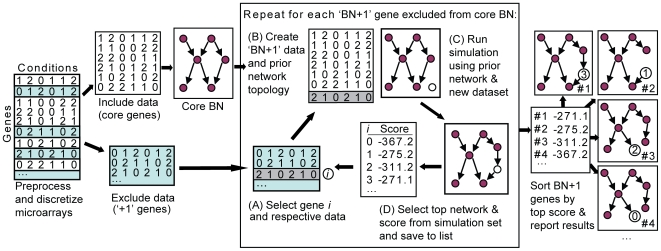
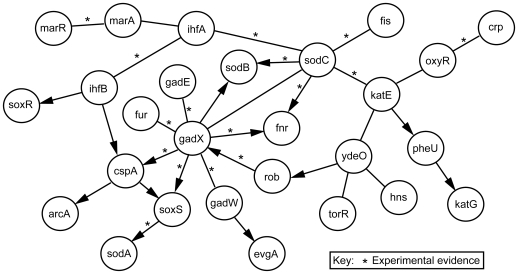
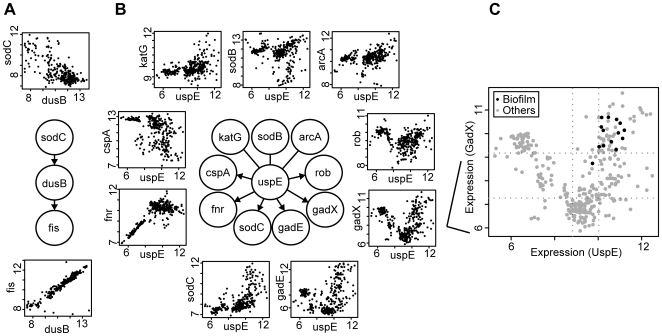
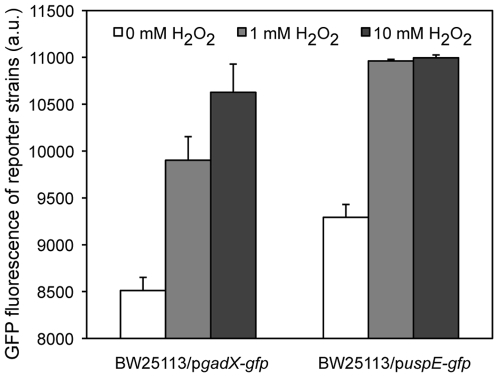
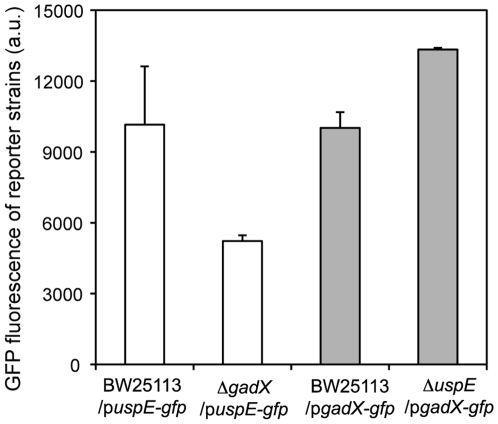
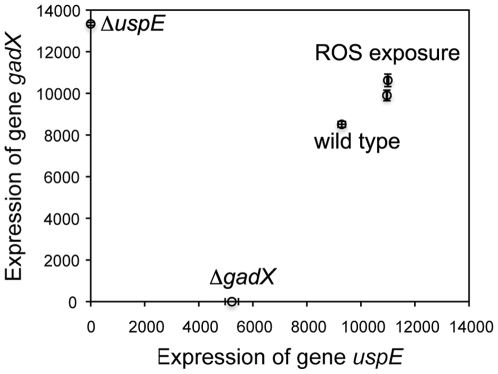
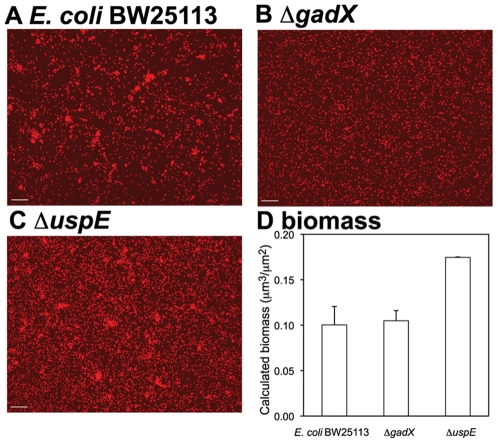
Signaling and regulatory pathways that guide gene expression have only been partially defined for most organisms. However, given the increasing number of microarray measurements, it may be possible to reconstruct such pathways and uncover missing connections directly from experimental data. Using a compendium of microarray gene expression data obtained from Escherichia coli, we constructed a series of Bayesian network models for the reactive oxygen species (ROS) pathway as defined by EcoCyc. A consensus Bayesian network model was generated using those networks sharing the top recovered score. This microarray-based network only partially agreed with the known ROS pathway curated from the literature and databases. A top network was then expanded to predict genes that could enhance the Bayesian network model using an algorithm we termed 'BN+1'. This expansion procedure predicted many stress-related genes (e.g., dusB and uspE), and their possible interactions with other ROS pathway genes. A term enrichment method discovered that biofilm-associated microarray data usually contained high expression levels of both uspE and gadX. The predicted involvement of gene uspE in the ROS pathway and interactions between uspE and gadX were confirmed experimentally using E. coli reporter strains. Genes gadX and uspE showed a feedback relationship in regulating each other's expression. Both genes were verified to regulate biofilm formation through gene knockout experiments. These data suggest that the BN+1 expansion method can faithfully uncover hidden or unknown genes for a selected pathway with significant biological roles. The presently reported BN+1 expansion method is a generalized approach applicable to the characterization and expansion of other biological pathways and living systems.
Conflict of interest statement
Figures
Similar articles
-
BN+1 Bayesian network expansion for identifying molecular pathway elements.Commun Integr Biol. 2010 Nov;3(6):549-54. doi: 10.4161/cib.3.6.12845. Epub 2010 Nov 1. Commun Integr Biol. 2010. PMID: 21331236 Free PMC article.
-
GadX/GadW-dependent regulation of the Escherichia coli acid fitness island: transcriptional control at the gadY-gadW divergent promoters and identification of four novel 42 bp GadX/GadW-specific binding sites.Mol Microbiol. 2008 Nov;70(4):965-82. doi: 10.1111/j.1365-2958.2008.06458.x. Epub 2008 Sep 18. Mol Microbiol. 2008. PMID: 18808381
-
The condition-dependent transcriptional network in Escherichia coli.Ann N Y Acad Sci. 2009 Mar;1158:29-35. doi: 10.1111/j.1749-6632.2008.03746.x. Ann N Y Acad Sci. 2009. PMID: 19348629
-
Methods to reconstruct and compare transcriptional regulatory networks.Methods Mol Biol. 2009;541:163-80. doi: 10.1007/978-1-59745-243-4_8. Methods Mol Biol. 2009. PMID: 19381525 Review.
-
A Combined Bayesian and Similarity-Based Approach for Predicting E. coli Biofilm Inhibition by Phenolic Natural Compounds.J Nat Prod. 2022 Oct 28;85(10):2255-2265. doi: 10.1021/acs.jnatprod.2c00005. Epub 2022 Sep 15. J Nat Prod. 2022. PMID: 36107719 Review.
Cited by
-
Revealing the complexity of health determinants in resource-poor settings.Am J Epidemiol. 2012 Dec 1;176(11):1051-9. doi: 10.1093/aje/kws183. Epub 2012 Nov 8. Am J Epidemiol. 2012. PMID: 23139247 Free PMC article.
-
Ontology-supported research on vaccine efficacy, safety and integrative biological networks.Expert Rev Vaccines. 2014 Jul;13(7):825-41. doi: 10.1586/14760584.2014.923762. Epub 2014 Jun 7. Expert Rev Vaccines. 2014. PMID: 24909153 Free PMC article. Review.
-
Global transcriptomic responses of Escherichia coli K-12 to volatile organic compounds.Sci Rep. 2016 Jan 28;6:19899. doi: 10.1038/srep19899. Sci Rep. 2016. PMID: 26818886 Free PMC article.
-
Presence of putative repeat-in-toxin gene tosA in Escherichia coli predicts successful colonization of the urinary tract.mBio. 2011 May 3;2(3):e00066-11. doi: 10.1128/mBio.00066-11. Print 2011. mBio. 2011. PMID: 21540363 Free PMC article.
-
Bayesian networks for network inference in biology.J R Soc Interface. 2025 May;22(226):20240893. doi: 10.1098/rsif.2024.0893. Epub 2025 May 7. J R Soc Interface. 2025. PMID: 40328299 Free PMC article. Review.
References
Publication types
MeSH terms
Substances
Grants and funding
LinkOut - more resources
Full Text Sources
Molecular Biology Databases
