. 2010 Mar 3;5(3):e9514.
doi: 10.1371/journal.pone.0009514.

Transgenerational adaptation of Arabidopsis to stress requires DNA methylation and the function of Dicer-like proteins

Affiliations

Transgenerational adaptation of Arabidopsis to stress requires DNA methylation and the function of Dicer-like proteins

Alex Boyko et al. PLoS One. .

Erratum in

  • PLoS One. 2010;5(4). doi: 10.1371/annotation/726f31b5-99c4-44e9-9cd6-b8d66b3f6038. Hollander, Jens [corrected to Hollunder, Jens]

Abstract

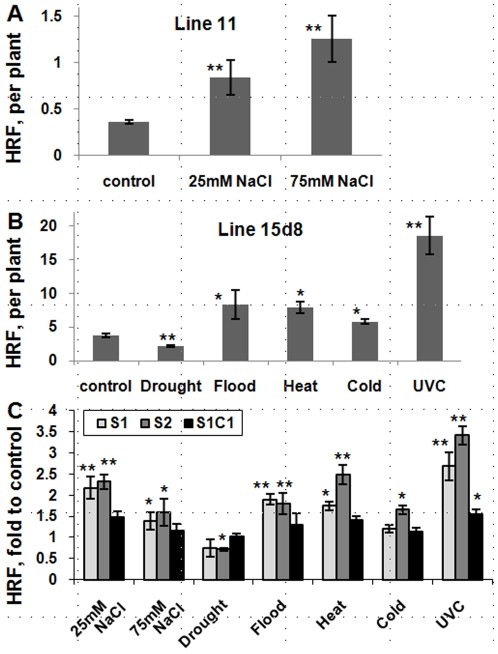
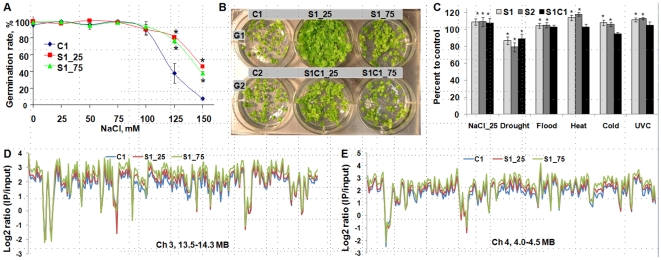
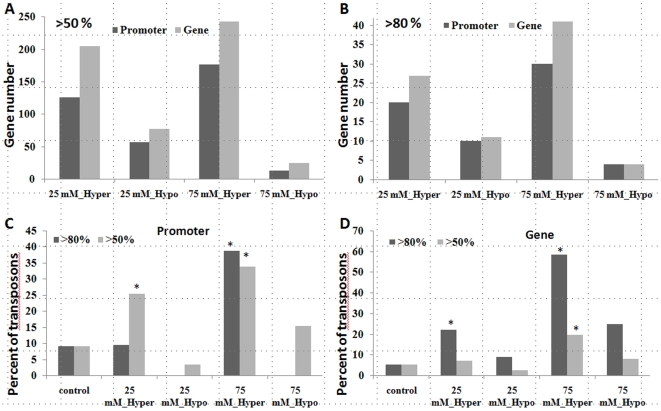
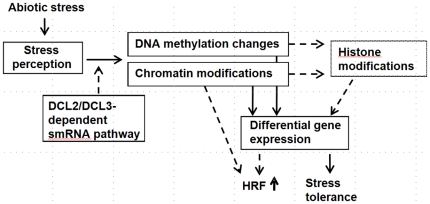
Epigenetic states and certain environmental responses in mammals and seed plants can persist in the next sexual generation. These transgenerational effects have potential adaptative significance as well as medical and agronomic ramifications. Recent evidence suggests that some abiotic and biotic stress responses of plants are transgenerational. For example, viral infection of tobacco plants and exposure of Arabidopsis thaliana plants to UVC and flagellin can induce transgenerational increases in homologous recombination frequency (HRF). Here we show that exposure of Arabidopsis plants to stresses, including salt, UVC, cold, heat and flood, resulted in a higher HRF, increased global genome methylation, and higher tolerance to stress in the untreated progeny. This transgenerational effect did not, however, persist in successive generations. Treatment of the progeny of stressed plants with 5-azacytidine was shown to decrease global genomic methylation and enhance stress tolerance. Dicer-like (DCL) 2 and DCL3 encode Dicer activities important for small RNA-dependent gene silencing. Stress-induced HRF and DNA methylation were impaired in dcl2 and dcl3 deficiency mutants, while in dcl2 mutants, only stress-induced stress tolerance was impaired. Our results are consistent with the hypothesis that stress-induced transgenerational responses in Arabidopsis depend on altered DNA methylation and smRNA silencing pathways.


Conflict of interest statement

Competing Interests: The authors have declared that no competing interests exist.

Figures

Figure 1
Figure 1. Experimental set-up.
A. Arabidopsis plants (G0) were propagated to the next generation (G1) under normal growth conditions (C1) or in the presence of stress (S1 for ‘stressed, generation 1’). Next, the S1 plants were propagated to G2 in the presence of stress (S2) or under normal conditions (S1C1). The C1 plants were propagated to G2 under normal conditions (C2). B–C. Plants used in the experiment carried in the genome β-glucuronidase (GUS) or luciferase transgenic marker genes serving as a homologous recombination substrate. Double strand break in the region of homology (depicted as ‘U’) can potentially be repaired via homologous recombination using the second region of homology as a template. This restores the active transgene. Cells and their progeny in which recombination events occurred can be visualized via either histochemical staining (GUS) (B) or via CCD camera (LUC) (C). Individual events are then scored in the population of 20–200 plants and expressed as an average number per single plant.
Figure 2
Figure 2. Arabidopsis plants show changes in somatic and transgenerational homologous recombination frequency (HRF) in response to stress.
HR events were counted in transgenic Arabidopsis plants from line 11 exposed to NaCl and from line 15d8 exposed to heat, cold, drought, flood and UVC. Asterisks show significant differences relative to controls, where one is p<0.05 and two is p<0.01 (a single- factor ANOVA). A. Somatic HRF is shown as the average number of events per single plant (the average of three experiments and s.d.) in a population of 200 plants per experimental group. B. Somatic HRF is shown as the average number of events per single plant (the average of three experiments and s.d.) in a population of 50 plants per experimental group. C. Non-induced HRF (the average of three experiments and s.e.m., as calculated from 50 plants per each experimental group) in the S1, S2 and S1C1 plants grown under control conditions. The data are shown as fold of respective to the control (C1 and C2) for the plants exposed to NaCl, drought and flood, heat and cold, and UVC.
Figure 3
Figure 3. Progeny of salt-stressed plants exhibit higher tolerance to salt and changes in methylation pattern.
A. NaCl tolerance was evaluated by germinating the progeny of plants exposed to 25 (S1_25) and 75 (S1_75) mM NaCl on media supplemented with 0–150 mM NaCl. Germination rates are shown in percentage (the average of three experiments and s.e.m., as calculated from 100 plants per plate, three plates per each experimental group). Asterisks show significant differences relative to controls (p<0.05, a single-factor ANOVA). B. The G1 and G2 (Figure 1A) generations of control and stressed plants were used for the analysis of tolerance to 150 mM NaCl. The S1 and S1C1 plants stemming from exposure to 25 and 75 mM NaCl are labeled as S1_25, S1_75 and S1C1_25, S1C1_75. Thirty to forty plants per each experimental group were geminated on normal media and then transferred to 150 mM NaCl. The picture was taken after two weeks of exposure. C. Global genome methylation patterns in the progeny of plants exposed to NaCl, drought, flood were analyzed using a cytosine extension assay . Methylation levels (the average of three experiments ± s.d.) are shown relative to the control groups (100%) (C1 or C2). Asterisks show significant differences relative to controls, where one is p<0.05 and two is p<0.01 (a single- factor ANOVA). D. MeDIP analysis of methylation in C1, S1_25 and S1_75 plants. The figure shows the methylation level as reflected by a log2 ratio of intensities of immunoprecipitated to input DNA in the region of 13.5–14.3 MB of the centromeric area of chromosome 3. Data for the C1 is in blue, whereas data for S1_25 and S_75 are in red and green, respectively. Data show hypermethylation of centromeric areas at chromosome 3 of the S1_25 and S1_75 plants. E. MeDIP analysis of methylation in C1, S1_25 and S1_75 plants. The figure shows the methylation level as reflected by a log2 ratio of intensities of immunoprecipitated to input DNA in the region of 4.0–4.5 MB of the centromeric area of chromosome 4. Data for the C1 is in blue, whereas data for S1_25 and S_75 are in red and green, respectively. Data show hypermethylation of centromeric areas of chromosome 4 of the S1_25 and S1_75 plants.
Figure 4
Figure 4. Analysis of methylation using Nimblgen tiling arrays shows many hypermethylated genes and promoters.
Methylation levels at a 5 kb promoter region and at a transcribed region of a gene were compared between S1_25 and C1 groups as well as between S1_75 and C1 groups. Regions with methylation changes of more than 50% and 80% were identified. Figure shows the number of genes and promoters that exhibit either more than 50% (A) or 80% (B) of methylation changes in S1_25 and S1_75 plants as compared to C1 plants. Figure C shows the percentage of transposons among all genes that were hyper- or hypomethylated at the promoter in S1_25 and S_75 plants. Figure D shows the same for the transcribed region.
Figure 5
Figure 5. S1_25 plants differ from C1 plants in expression of many genes.
Analysis of gene expression in S1_25 and C1 plants was done using Affymetrix microchips. The data from 3 chips per each experimental group were averaged, and two different cut-offs were performed. One was a 2-fold change and p-value of less than 0.05, and another–a 3-fold change and p-value of less than 0.01. A. Figure shows the number of up- and down-regulated genes belonging to the S1_25 group as compared to the C1 group. The numbers over the top of the bars show the gene number. B. Figure shows the percentile distribution of up- and down-regulated genes belonging to different pathways.
Figure 6
Figure 6. Pre-treatment with 5-azaC alleviates differences in stress tolerance and methylation changes.
A. Twenty plants per each experimental group were germinated in half-MS medium. The plants of control group remained in this medium for the entire length of the experiment. At 3 dpg, the plants belonging to a ‘transfer’ group were transferred to similar half-MS medium and served as a ‘transfer’ control. At 3 dpg, the plants of the ‘5-AzaC’ group were transferred to 50 µM 5-azaC. At 3 dpg, the plants of the ‘5-AzaC/NaCl’ group were transferred to 50 µM 5-azaC, and at 8 dpg, they were transferred to 100 mM NaCl. At 8 dpg, the plants of the ‘NaCl’ group were transferred to 100 mM NaCl. All plants were harvested at 19 dpg, and genomic DNA was prepared and digested either with HpaII or MspI. The experiment was repeated three times. B. Twenty plants from Ct1, S1_25 and S1_75 groups were germinated on half-MS medium supplemented with or without 5-azaC and at the age of one week were moved to 0, 100, 150 and 200 mM NaCl. The experiment was repeated three times. C. Root length (the average of 3 independent plates, 20 plants per each plate, with s.e.m.). Asterisks show significant differences between the S1_25 and the C1 group and the S1_75 and the C1 groups (a single-factor ANOVA, p<0.05, for all groups). D. The data are shown as percentage of methylation related to the methylation level in the C1 plants of the control group. Significant differences between S1_25 and C1 for each group (p<0.05 in all cases) are labelled with asterisks.
Figure 7
Figure 7. Changes in HRF and stress tolerance in DCL mutants.
A. HRF in the C1 and S1 progeny of the wt, dcl2, dcl3, dcl4, dcl2 dcl3 and dcl2 dcl3 dcl4 plants exposed to drought and flood stress. The ‘Y’ axis shows HRF (the average of 3 experiments and s.e.m.) as fold of S1 to C1, standardized to wt. Asterisks show significant differences in mutants as compared to wt (p<0.05; a single-factor ANOVA). B. HRF in the C1 and S1 progeny of the wt, dcl2, dcl3, dcl4, dcl2 dcl3 and dcl2 dcl3 dcl4 plants exposed to heat and cold stress. The ‘Y’ axis shows HRF (the average of 3 experiments and s.e.m.) as fold of S1 to C1, standardized to wt. C. HRF in the C1 and S1 progeny of the wt, dcl2, dcl3, dcl4, dcl2 dcl3 and dcl2 dcl3 dcl4 plants exposed to UVC and NaCl stress. The ‘Y’ axis shows HRF (the average of 3 experiments and s.e.m.) as fold of S1 to C1, standardized to wt. D. Root length of the C1 and S1 progeny of the heat-treated wt, dcl2, dcl3 and dcl4 plants germinated and grown in the presence of 80 and 100 ppm MMS. Root length was measured in 20 plantlets from each experimental group. The ‘Y’ axis shows a ratio of S1 to C1, standardized to wt. E. Representative Petri plates of the C1 (upper panel) and S1 (lower panel) progeny of the heat-treated wt (top right corner of each plate), dcl2 (top left corner), dcl3 (bottom right corner) and dcl4 (bottom left corner) plants germinated and grown in the presence of 80 and 100 ppm MMS. F. Representative plants of the C1 and S1 progeny of the heat-treated wt, dcl2, dcl3 and dcl4 plants germinated and grown in the presence of 80 ppm MMS. G. Representative plants of the C1 and S1 progeny of the heat-treated wt, dcl2 and dcl3 plants germinated and grown in the presence of 100 ppm MMS.
Figure 8
Figure 8. Changes in methylation in DCL mutants.
The progeny of the control (C1) plants and the progeny of plants exposed to heat and UVC (S1) belonging to wild type, dcl2, dcl3 and dcl4 groups were used for the analysis. Genomic DNA was prepared from 20 three-week-old plants per each experimental group, and methylation was measured via the cytosine extension assay using digestion with HpaII and MspI as described before . The data are shown as fold of methylation relative to the wild type C1 (ct) plants as calculated from 3 independent repeats. Significant differences between the C1 and S1 plants in each group are shown by asterisks (p<0.05). A. Data for HpaII. B. Data for MspI.
Figure 9
Figure 9. Potential mechanism of transgenerational changes in the progeny of stressed plants.
We hypothesize that exposure to stress triggers changes in plants that lead to transgenerational changes in methylation and possibly in chromatin modifications. This process is apparently dependent on the function of small RNAs. Chromatin modifications may be sufficient to trigger an increase in recombination frequency. Differential genome methylation and changes in chromatin structure could lead to differential gene expression that could also be a cause of the increase in stress tolerance and recombination frequency. Chromatin modifications could involve histone modifications, resulting in a differential pattern of hetero-/euchromatin and thus in changes in HRF and stress tolerance.

Similar articles

Cited by

References

    1. Grant-Downton RT, Dickinson HG. Epigenetics and its implications for plant biology 2. The ‘epigenetic epiphany’: epigenetics, evolution and beyond. Ann Bot (Lond) 2006;97:11–27. - PMC - PubMed
    1. Koturbash I, Baker M, Loree J, Kutanzi K, Hudson D, et al. Epigenetic dysregulation underlies radiation-induced transgenerational genome instability in vivo. Int J Radiat Oncol Biol Phys. 2006;66:327–330. - PubMed
    1. Molinier J, Ries G, Zipfel C, Hohn B. Transgeneration memory of stress in plants. Nature. 2006;442:1046–1049. - PubMed
    1. Pembrey ME, Bygren LO, Kaati G, Edvinsson S, Northstone K, et al. Sex-specific, male-line transgenerational responses in humans. Eur J Hum Genet. 2006;14:159–166. - PubMed
    1. Blodner C, Goebel C, Feussner I, Gatz C, Polle A. Warm and cold parental reproductive environments affect seed properties, fitness, and cold responsiveness in Arabidopsis thaliana progenies. Plant Cell Environ. 2007;30:165–175. - PubMed

Publication types