

A quantitative study of the Hog1 MAPK response to fluctuating osmotic stress in Saccharomyces cerevisiae
- PMID: 20209100
- PMCID: PMC2831999
- DOI: 10.1371/journal.pone.0009522
A quantitative study of the Hog1 MAPK response to fluctuating osmotic stress in Saccharomyces cerevisiae
Abstract
Background: Yeast cells live in a highly fluctuating environment with respect to temperature, nutrients, and especially osmolarity. The Hog1 mitogen-activated protein kinase (MAPK) pathway is crucial for the adaption of yeast cells to external osmotic changes.
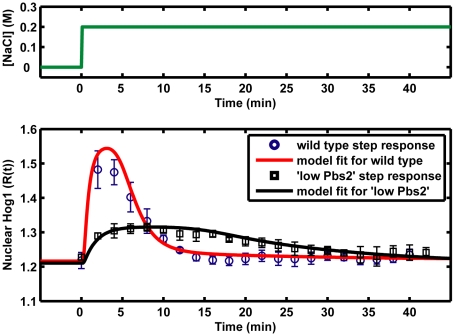
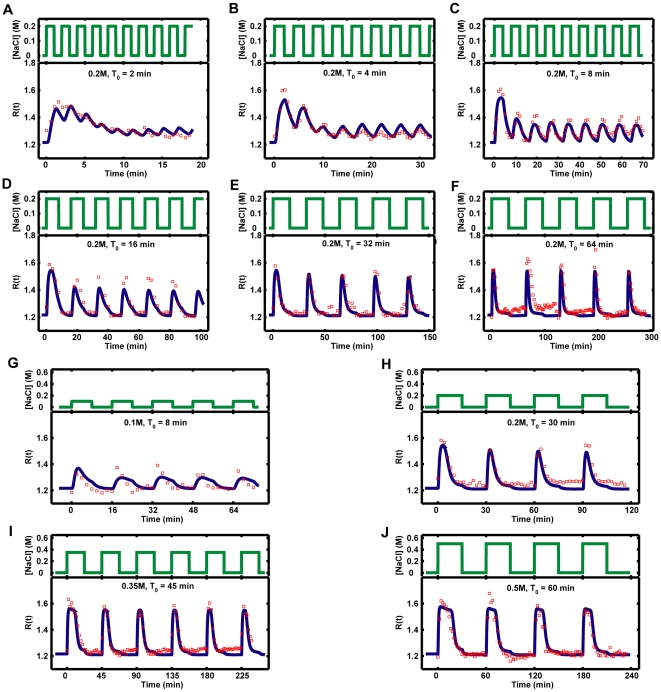
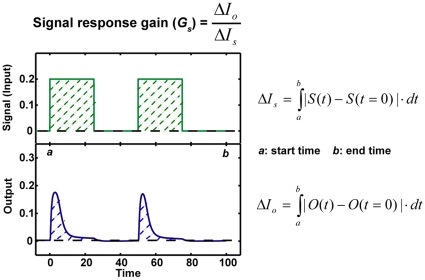
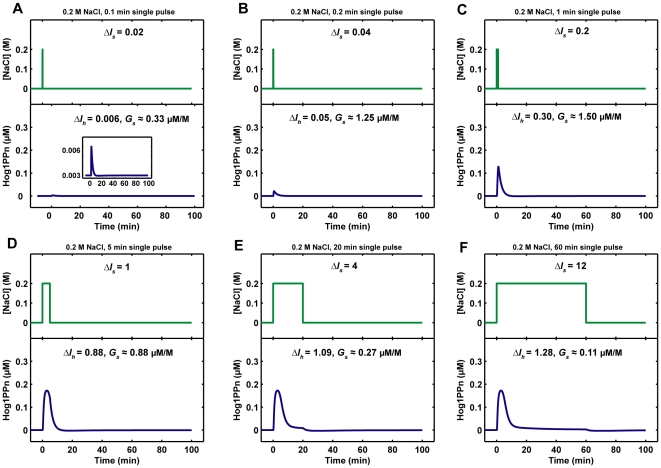
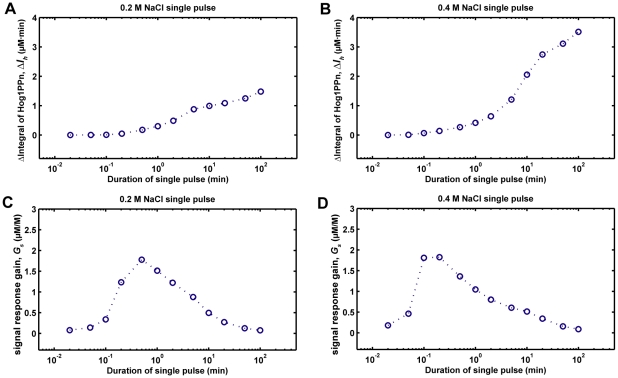
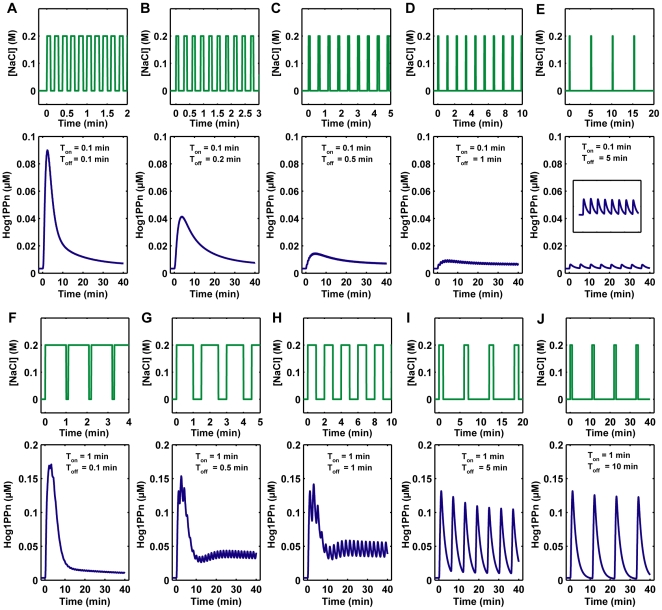
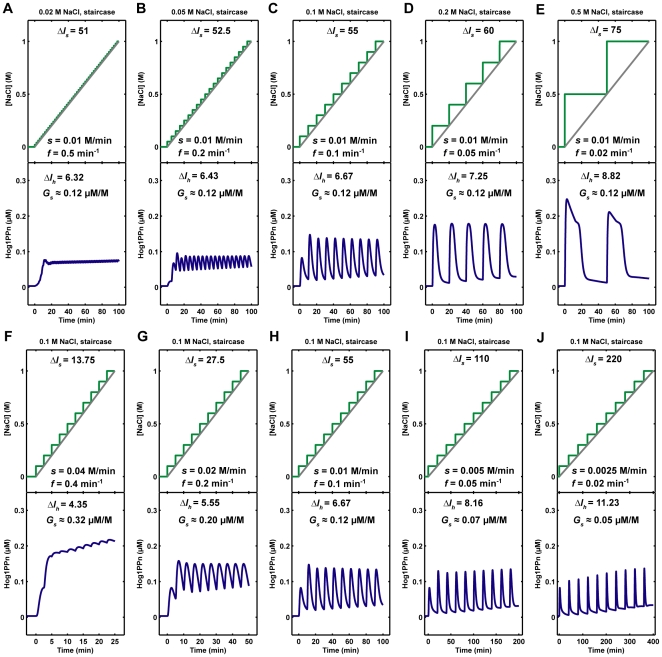
Methodology/principal findings: To better understand the osmo-adaption mechanism in the budding yeast Saccharomyces cerevisiae, we have developed a mathematical model and quantitatively investigated the Hog1 response to osmotic stress. The model agrees well with various experimental data for the Hog1 response to different types of osmotic changes. Kinetic analyses of the model indicate that budding yeast cells have evolved to protect themselves economically: while they show almost no response to fast pulse-like changes of osmolarity, they respond periodically and are well-adapted to osmotic changes with a certain frequency. To quantify the signal transduction efficiency of the osmo-adaption network, we introduced a measure of the signal response gain, which is defined as the ratio of output change integral to input (signal) change integral. Model simulations indicate that the Hog1 response gain shows bell-shaped response curves with respect to the duration of a single osmotic pulse and to the frequency of periodic square osmotic pulses, while for up-staircase (ramp) osmotic changes, the gain depends on the slope.
Conclusions/significance: The model analyses suggest that budding yeast cells have selectively evolved to be optimized to some specific types of osmotic changes. In addition, our work implies that the signaling output can be dynamically controlled by fine-tuning the signal input profiles.
Conflict of interest statement
Figures
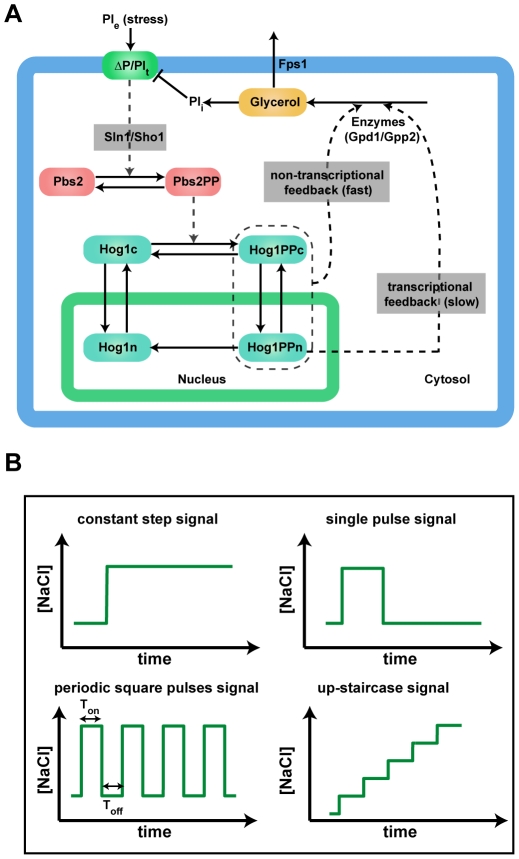
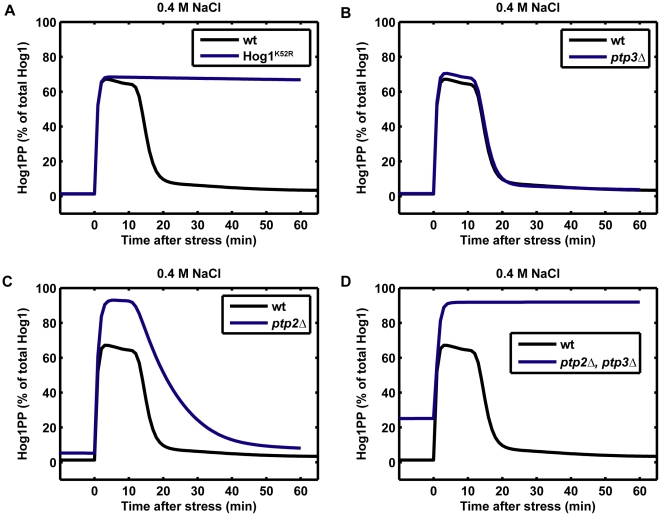
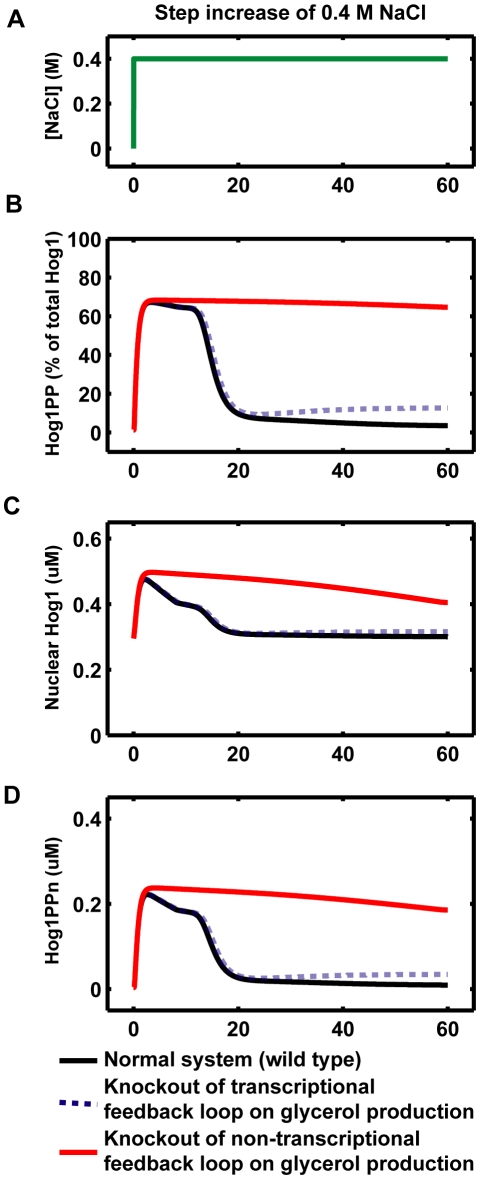
 = 0 to simulate the knockout of the non-transcriptional feedback loop (Hog1 kinase, totalHog1PP, dependent) on glycerol production. The simulation results are shown in red curves in panel B–D. We set
  = 0 to simulate the knockout of the transcriptional feedback loop (nuclear phosphorylated Hog1, Hog1PPn, dependent) on glycerol production. The simulation results are shown in blue dotted curves in panel B–D.
Similar articles
-
Kinase activity-dependent nuclear export opposes stress-induced nuclear accumulation and retention of Hog1 mitogen-activated protein kinase in the budding yeast Saccharomyces cerevisiae.Mol Biol Cell. 1999 Apr;10(4):1147-61. doi: 10.1091/mbc.10.4.1147. Mol Biol Cell. 1999. PMID: 10198063 Free PMC article.
-
Initiation of the transcriptional response to hyperosmotic shock correlates with the potential for volume recovery.FEBS J. 2013 Aug;280(16):3854-67. doi: 10.1111/febs.12382. Epub 2013 Jul 5. FEBS J. 2013. PMID: 23758973
-
Analysis of mitogen-activated protein kinase signaling specificity in response to hyperosmotic stress: use of an analog-sensitive HOG1 allele.Eukaryot Cell. 2006 Aug;5(8):1215-28. doi: 10.1128/EC.00037-06. Eukaryot Cell. 2006. PMID: 16896207 Free PMC article.
-
Yeast osmoregulation.Methods Enzymol. 2007;428:29-45. doi: 10.1016/S0076-6879(07)28002-4. Methods Enzymol. 2007. PMID: 17875410 Review.
-
Hog1: 20 years of discovery and impact.Sci Signal. 2014 Sep 16;7(343):re7. doi: 10.1126/scisignal.2005458. Sci Signal. 2014. PMID: 25227612 Review.
Cited by
-
Effect of salinity stress on plants and its tolerance strategies: a review.Environ Sci Pollut Res Int. 2015 Mar;22(6):4056-75. doi: 10.1007/s11356-014-3739-1. Epub 2014 Nov 16. Environ Sci Pollut Res Int. 2015. PMID: 25398215 Review.
-
Hyperosmotic Stress Response Memory is Modulated by Gene Positioning in Yeast.Cells. 2019 Jun 13;8(6):582. doi: 10.3390/cells8060582. Cells. 2019. PMID: 31200564 Free PMC article.
-
Yeast cell responses and survival during periodic osmotic stress are controlled by glucose availability.Elife. 2024 Apr 3;12:RP88750. doi: 10.7554/eLife.88750. Elife. 2024. PMID: 38568203 Free PMC article.
-
A systems biology analysis of long and short-term memories of osmotic stress adaptation in fungi.BMC Res Notes. 2012 May 25;5:258. doi: 10.1186/1756-0500-5-258. BMC Res Notes. 2012. PMID: 22631601 Free PMC article.
-
An integrative model of ion regulation in yeast.PLoS Comput Biol. 2013;9(1):e1002879. doi: 10.1371/journal.pcbi.1002879. Epub 2013 Jan 17. PLoS Comput Biol. 2013. PMID: 23341767 Free PMC article.
References
-
- Westfall PJ, Ballon DR, Thorner J. When the stress of your environment makes you go HOG wild. Science. 2004;306:1511–1512. - PubMed
-
- Elston TC. Probing pathways periodically. Sci Signal. 2008;1:pe47. - PubMed
-
- Escote X, Zapater M, Clotet J, Posas F. Hog1 mediates cell-cycle arrest in G1 phase by the dual targeting of Sic1. Nat Cell Biol. 2004;6:997–1002. - PubMed
Publication types
MeSH terms
Substances
LinkOut - more resources
Full Text Sources
Molecular Biology Databases
