. 2010 Mar 2;5(3):e9496.
doi: 10.1371/journal.pone.0009496.

Erythroid progenitor cells expanded from peripheral blood without mobilization or preselection: molecular characteristics and functional competence

Affiliations

Erythroid progenitor cells expanded from peripheral blood without mobilization or preselection: molecular characteristics and functional competence

Claudia Filippone et al. PLoS One. .

Abstract

Background: Continued development of in-vitro procedures for expansion and differentiation of erythroid progenitor cells (EPC) is essential not only in hematology and stem cell research but also virology, in light of the strict erythrotropism of the clinically important human parvovirus B19.

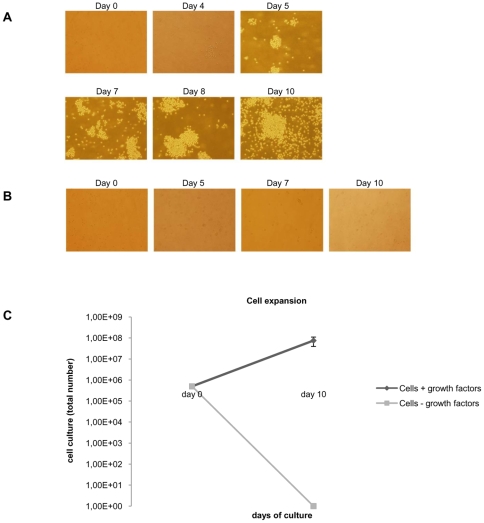
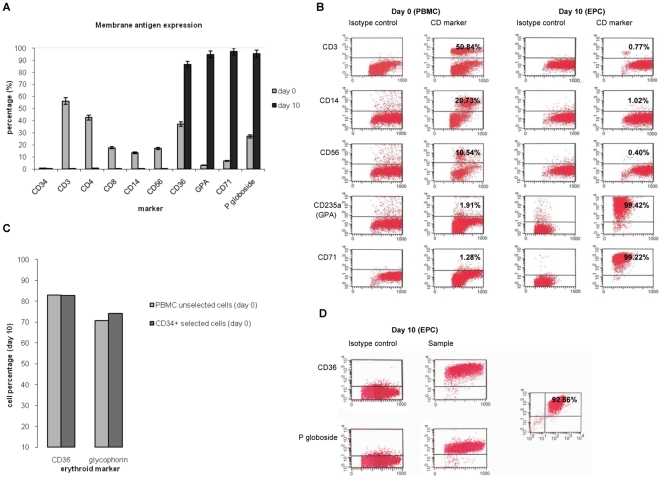
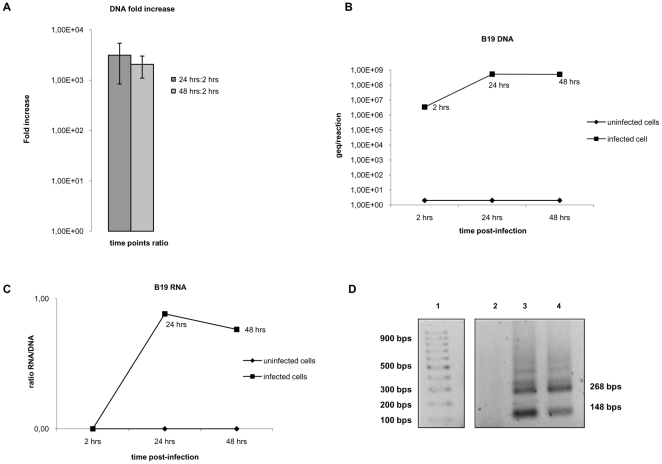
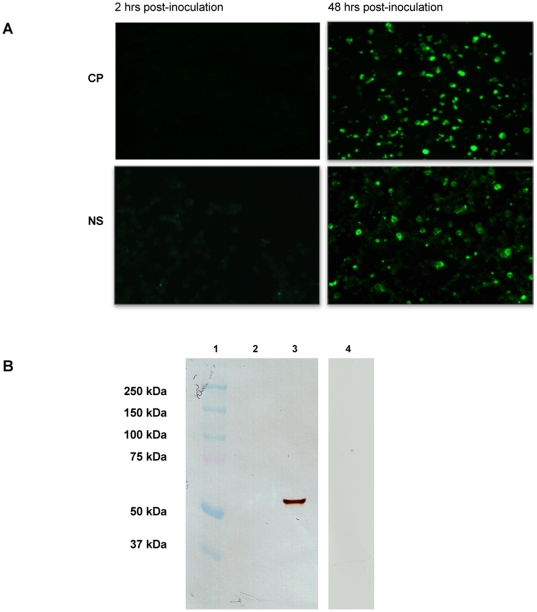
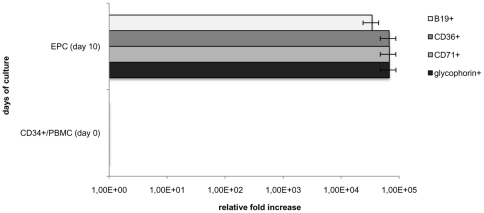
Methodology/principal findings: We cultured EPC directly from ordinary blood samples, without ex vivo stem cell mobilization or CD34+ cell in vitro preselection. Profound increase in the absolute cell number and clustering activity were observed during culture. The cells obtained expressed the EPC marker combination CD36, CD71 and glycophorin, but none of the lymphocyte, monocyte or NK markers. The functionality of the generated EPC was examined by an in vitro infection assay with human parvovirus B19, tropic for BFU-E and CFU-E cells. Following infection (i) viral DNA replication and mRNA production were confirmed by quantitative PCR, and (ii) structural and nonstructural proteins were expressed in >50% of the cells. As the overall cell number increased 100-200 fold, and the proportion of competent EPC (CD34+ to CD36+) rose from <0.5% to >50%, the in vitro culture procedure generated the EPC at an efficiency of >10,000-fold. Comparative culturing of unselected PBMC and ex vivo-preselected CD34+ cells produced qualitatively and quantitatively similar yields of EPC.

Conclusions/significance: This approach yielding EPC directly from unmanipulated peripheral blood is gratifyingly robust and will facilitate the study of myeloid infectious agents such as the B19 virus, as well as the examination of erythropoiesis and its cellular and molecular mechanisms.


Conflict of interest statement

Competing Interests: The authors have declared that no competing interests exist.

Figures

Figure 1
Figure 1. Phenotypic changes during cell culture from peripheral blood.
(A) PBMC were isolated and cultured with growth factors favouring erythroid expansion and observed with an optical inverted microscope (Olympus IX71). Photographs were taken at 10× magnification with a Hamamatsu C8484-05G digital camera. (B) PBMC cultured as in panel A, but without the growth factors. (C) Numbers of cells cultured with or without the growth factors. Error bars indicate standard deviation.
Figure 2
Figure 2. Flow cytometry analysis during culture with growth factors.
Expression of cellular membrane antigen markers on day 0 and after 10 days of culture in presence of growth factors. FITC or PE labelled primary monoclonal antibodies for CD markers were used for cell staining. For each monoclonal antibody the correspondent anti-isotype antibody was used in parallel to test the specificity of the staining. Polyclonal rabbit antibody and antirabbit FITC were used to detect globoside P. (A) The histogram represents the percentages of positive cells to each marker analyzed; average of 5 experiments. Bars indicate percentage error. (B) Flow cytometry patterns of main lymphocyte, monocyte and erythroid markers on day 0 and on cultured cells. Representative experiment. Images were corrected for color uniformity by AdobePhotoshop software. (C) Comparison between unselected PBMC and CD34+-selected cells as culture source. Expression of CD36 and glycophorin on day 10 of culture. Representative experiment. (D) Expression of CD36 and globoside P on day 10. Representative experiment.
Figure 3
Figure 3. Cellular B19 virus DNA and RNA levels during in vitro infection.
DNA and RNA were extracted following B19 in vitro infection of the obtained EPC. Real-time PCR and RT-PCR were performed. (A) B19 DNA fold increase at 24–48 hrs versus 2 hrs post-infection. Average of 3 experiments. Error bars indicate standard deviation. (B) Viral DNA pattern in cells harvested after in vitro infection. Absolute quantification was determined following qPCR of the extracts at different time-points. Representative experiment. (C) Relative amount of B19 RNA in cells harvested after infection. The obtained values take into account the qPCR results of the DNA template and the RNA in both presence and absence of retrotranscriptase. Representative experiment. (D) Agarose gel analysis of real-time RT-PCR amplicons. Lane 1: molecular weight markers. Spliced RNA in cells at 2 hrs (lane 2), 24 hrs (lane 3) and 48 hrs (lane 4) post-infection.
Figure 4
Figure 4. Permissivity of EPC for parvovirus B19 virus infection. Viral protein expression.
(A) Immunofluorescence staining for viral capsid (VP) and nonstructural (NS1) proteins of cells infected on day 10 of culture, and fixed at 2 or 48 hrs post-infection. Monoclonal mouse antibody and human antibody were used to detect VP1-VP2 and NS1 respectively, followed by anti-mouse or anti- human FITC antibodies. The cells were observed with a Zeiss Axioplan 2 UV microscope. Photographs taken at 20× magnification. (B) Western blotting of lysates of uninfected (lane 2) or infected (lane 3) cells labeled with the monoclonal B19 capsid protein (VP) antibody. Infected cells labeled with isotype control antibody (lane 4). Lane 1: molecular weight markers.
Figure 5
Figure 5. Expansion of EPC cultured from unselected PBMC.
Grey bars: fold-increase of cells expressing CD36, CD71 and glycophorin markers on day 10 of culture. The values are based on the flow cytometry analysis of Figure 2 and the cell counts of Figure 1C and Table 1. White bar: fold-increase of B19 virus permissive EPC; percentage of cells expressing capsid proteins at 48 hrs post-infection (Fig. 4A). Bars represent error percentage.

References

    1. Correa PN, Axelrad AA. Production of erythropoietic bursts by progenitor cells from adult human peripheral blood in an improved serum-free medium: role of insulinlike growth factor 1. Blood. 1991;78:2823–2833. - PubMed
    1. de Wolf JT, Muller EW, Hendriks DH, Halie RM, Vellenga E. Mast cell growth factor modulates CD36 antigen expression on erythroid progenitors from human bone marrow and peripheral blood associated with ongoing differentiation. Blood. 1994;84:59–64. - PubMed
    1. Emerson SG, Thomas S, Ferrara JL, Greenstein JL. Developmental regulation of erythropoiesis by hematopoietic growth factors: analysis on populations of BFU-E from bone marrow, peripheral blood, and fetal liver. Blood. 1989;74:49–55. - PubMed
    1. Fibach E, Manor D, Oppenheim A, Rachmilewitz EA. Proliferation and maturation of human erythroid progenitors in liquid culture. Blood. 1989;73:100–103. - PubMed
    1. Freyssinier JM, Lecoq-Lafon C, Amsellem S, Picard F, Ducrocq R, et al. Purification, amplification and charaterization of a population of human erythroid progenitors. Br J Haematol. 1999;106:912–922. - PubMed

Publication types