. 2010 Mar 3;5(3):e9485.
doi: 10.1371/journal.pone.0009485.

The two stem cell microRNA gene clusters C19MC and miR-371-3 are activated by specific chromosomal rearrangements in a subgroup of thyroid adenomas

Affiliations

The two stem cell microRNA gene clusters C19MC and miR-371-3 are activated by specific chromosomal rearrangements in a subgroup of thyroid adenomas

Volkhard Rippe et al. PLoS One. .

Abstract

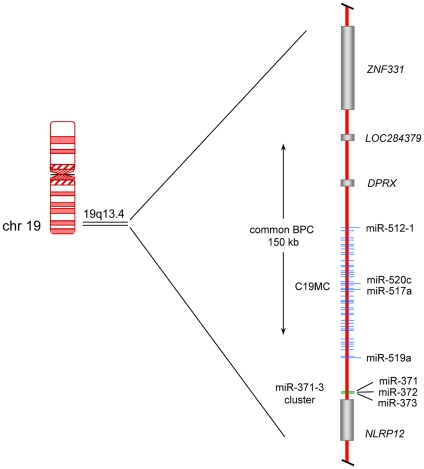
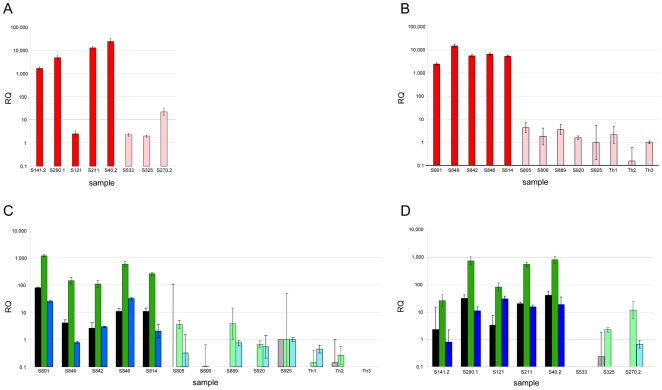
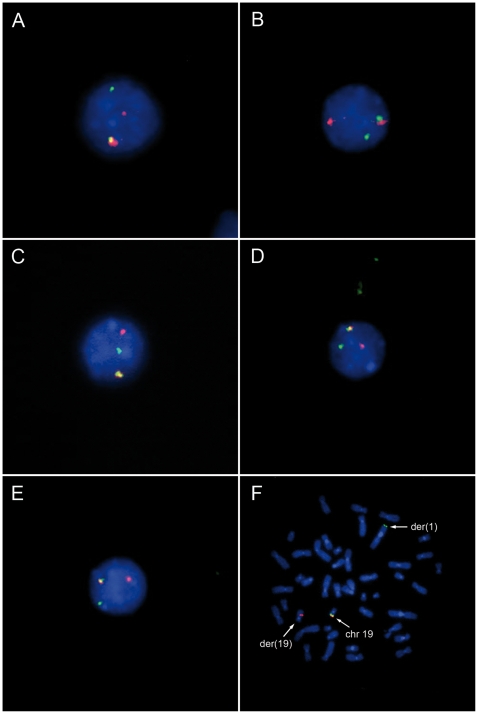
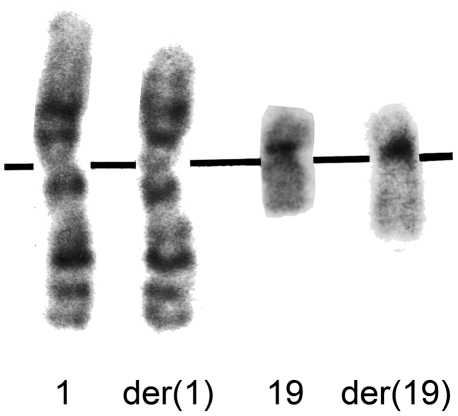
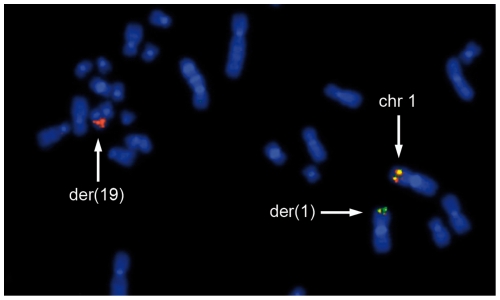
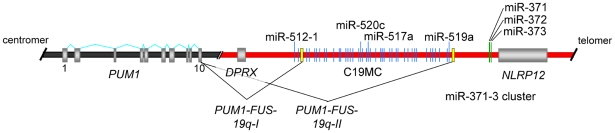
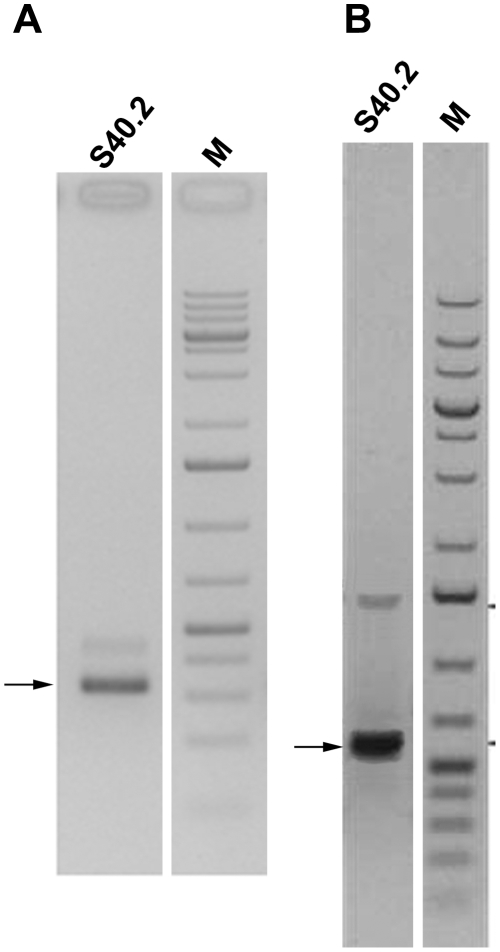
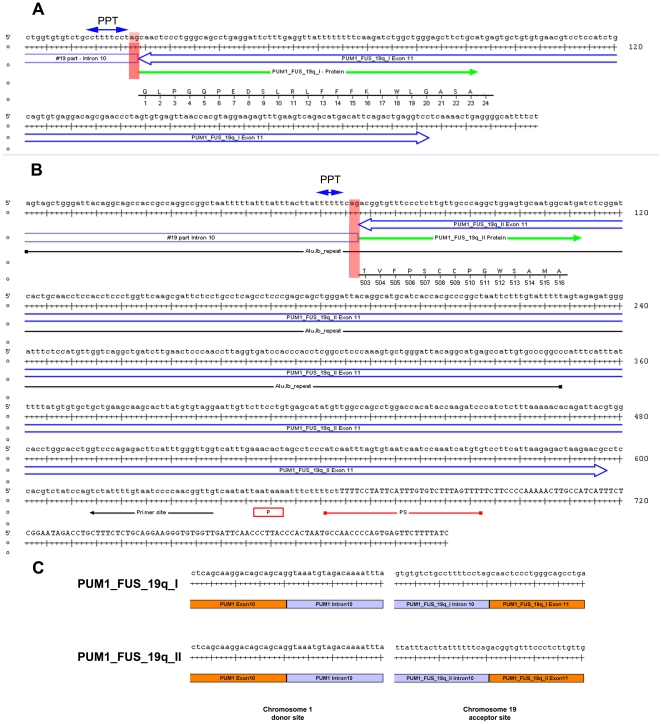
Thyroid adenomas are common benign human tumors with a high prevalence of about 5% of the adult population even in iodine sufficient areas. Rearrangements of chromosomal band 19q13.4 represent a frequent clonal cytogenetic deviation in these tumors making them the most frequent non-random chromosomal translocations in human epithelial tumors at all. Two microRNA (miRNA) gene clusters i.e. C19MC and miR-371-3 are located in close proximity to the breakpoint region of these chromosomal rearrangements and have been checked for a possible up-regulation due to the genomic alteration. In 4/5 cell lines established from thyroid adenomas with 19q13.4 rearrangements and 5/5 primary adenomas with that type of rearrangement both the C19MC and miR-371-3 cluster were found to be significantly overexpressed compared to controls lacking that particular chromosome abnormality. In the remaining cell line qRT-PCR revealed overexpression of members of the miR-371-3 cluster only which might be due to a deletion accompanying the chromosomal rearrangement in that case. In depth molecular characterization of the breakpoint in a cell line from one adenoma of this type reveals the existence of large Pol-II mRNA fragments as the most likely source of up-regulation of the C19MC cluster. The up-regulation of the clusters is likely to be causally associated with the pathogenesis of the corresponding tumors. Of note, the expression of miRNAs miR-520c and miR-373 is known to characterize stem cells and in terms of molecular oncology has been implicated in invasive growth of epithelial cells in vitro and in vivo thus allowing to delineate a distinct molecular subtype of thyroid adenomas. Besides thyroid adenomas rearrangements of 19q13.4 are frequently found in other human neoplasias as well, suggesting that activation of both clusters might be a more general phenomenon in human neoplasias.


Conflict of interest statement

Competing Interests: The authors declare competing financial interests because of a patent application claiming the expression level of the miRNA miR371–373 and miR C19MC clusters for the diagnosis of thyroid tumors (EP 09011141.0, applicant: University of Bremen).

Figures

Figure 1
Figure 1. Scheme of the chromosomal region 19q13.4 with the two miRNA clusters C19MC and miR-371-3.
Protein coding genes are represented by gray bars whereas genes of miRNA clusters are given as blue (C19MC cluster) and green (miR-371-3 cluster) lines, respectively. The common breakpoint cluster (BPC) of benign thyroid tumors of about 150 kb is indicated by a vertical arrow. miR-512-1 (pre-miR) is coding for mature-miR-512-5p, miR-371 (pre-miR) is coding for mature-miR371-3p. Gene symbols refer to the following protein coding genes: ZNF331  =  zinc finger protein 331, DPRX  =  divergent-paired related homeobox, NLRP12  =  NLR family, pyrin domain containing 12.
Figure 2
Figure 2. Expression analysis of miR-517a by RT-PCR.
PCR reactions were performed and then analyzed in 4% small DNA Agarose. The expected DNA-fragment has a size of 62 bp, Ultra low range Ladder (Fermentas) was used as Marker (M). Lane 1: S40.2, 2: S40.2 without reverse transcriptase (–RT), 3: S121, 4: S121–RT, 5: thyroid (normal), 6: thyroid–RT, 7: placenta, 8: placenta-RT, 9: S270.2, 10: S270.2–RT, 11: S290.1, 12: S290.1–RT, 13: S141.2, 14: S325, 15: S211, 16: S211–RT, 17: fetal RNA, 18: adult testis, 19: fetal RNA-RT, 20: S141.2-RT, 21: adult testis-RT, 22: S325-RT (for details of the cell lines and tumor samples see Table 1).
Figure 3
Figure 3. Expression of miR-520c, miR-371-3p, miR-372 and miR-373 in cell lines and primary tumors.
Relative expression of miRNAs was determined by real-time PCR (mean s.d. from three independent experiments). Values of miRNA were normalized to RNU6B (RNA, U6 small nuclear 2) (A) miR-520c expression in thyroid cell lines, five cell lines derived from adenomas with 19q13.4 rearrangements (S141.2, S290.1, S121, S211, S40.2) (red bars) and three cell lines derived from thyroid adenomas with other structural rearrangements (S533, S325, S270.2) (light red bars). (B) miR-520c expression in three samples of non-neoplastic thyroid tissues (Th1, Th2, Th3) (light red bars), five adenomas with 19q13.4 rearrangement (S801, S849, S842, S846, S814) (red bars) and five adenomas without cytogenetically detectable aberrations (S805, S806, S889, S920, S925) (light red bars). (C) miR-371-3 expression in three samples of non-neoplastic thyroid tissues (gray (miR-371-3p), light green (miR-372) and light blue (miR-373)), five adenomas with 19q13.4 rearrangement (black (miR-371-3p), green (miR-372) and blue (miR-373)) and five adenomas without cytogenetically detectable aberrations (gray, light green and light blue bars) (for case numbers refer to Table 1). (D) miR-371-3 expression in thyroid cell lines, five cell lines derived from adenomas with 19q13.4 rearrangements (black (miR-371-3p), green (miR-372) and blue (miR-373)) and three cell lines derived from thyroid adenomas with other structural rearrangements (gray (miR-371-3p), light green (miR-372) and light blue (miR-373)) (for case numbers refer to Table 1).
Figure 4
Figure 4. Fluorescence in situ hybridization (FISH) with dual-color, break-apart rearrangement probe (tbpc19).
(A)(E) I-FISH showing 19q13 rearrangements detected using touch-preparations of five thyroid adenomas (A: S801, B: S814, C: S842, D: S846, E: S849) indicated by separated green (3′-tbpc19) and red signals (5′-tbpc19); (F) Metaphase of case S842 with a t(1;19)(q32;q13) after FISH with tbpc19. The 19q13 rearrangement is indicated also by separated signals on der(1) and der(19).
Figure 5
Figure 5. Partial karyotype of cell line S40.2.
Partial G-banded karyotype showing chromosome 1 and 19 as well as their derivatives resulting from t(1;19)(p35.2;q13.4).
Figure 6
Figure 6. Delineation of PUM1 breakpoint by metaphase FISH.
Part of metaphase of cell line S40.2 after FISH with two overlapping BAC clones RP11-201O14 (green) and RP11-1136E4 (red) both spanning the whole genomic sequence of PUM1 in 1p35.2. The breakpoint in 1p35.2 is located within PUM1 indicated by a separation of RP11-201O14 and RP11-1136E4. Because of weak signals of RP11-1136E4 remaining on the der(1) the breakpoint is located within RP11-1136E4 distal to RP11-201O14.
Figure 7
Figure 7. Genomic organization of the fusion gene on the derivative chromosome 1 resulting from a translocation t(1;19)(p35.2;13.4) in cell line S40.2.
Detailed schematic overview illustrating the origin of the fusion transcripts PUM1-FUS-19q-I (Genbank Accession number GQ334687) and PUM1-FUS-19q-II (Genbank Accession number GQ334688) identified in cell line S40.2. The genomic region of PUM1 in 1p35.2 (horizontal gray bar) fuses after exon 10 of PUM1 (exons: vertical light gray bars) to the genomic region of C19MC in 19q13.4 (horizontal red bar). The two vertical yellow bars indicate 3′-sequences located after exon 1–10 of PUM1 in PUM1-FUS-19q-I and PUM1-FUS-19q-II, respectively, both originating from alternative splicing. The fusion transcripts were detected either by 3′-RACE-PCR (PUM1-FUS-19q-I) or RT-PCR (PUM1-FUS-19q-II) experiments. The quantified miRNAs have been highlighted by their names.
Figure 8
Figure 8. Cloning of fusion transcripts PUM1-FUS-19q-I and PUM1-FUS-19q-II.
Fusion transcripts resulting from the t(1;19) in cell line S40.2 were detected by RT-PCR and analyzed by gel electrophoresis. M =  Marker DNA (1 kb+, Fermentas). S40.2 =  Thyroid adenoma cell line S40.2. The arrows point to the corresponding bands that were excised. Isolated DNA was sequenced and analyzed. Weak bands above may represent splice variants. A) Transcript PUM1-FUS-19q-I generated with primers Ex9_up and 19_2. B) Transcript PUM1-FUS-19q-II generated with primers Ex9_up and 500_Cluster_polyA_I.
Figure 9
Figure 9. Sequence analysis of the genomic structure of PUM1-FUS-19q.
Genomic organization of part of FUS-19q. Blue double arrows indicate exon 11 of PUM1-FUS-19q. The green arrow marks the final part of the fusion protein. The underlying ruler shows the final amino acid sequence. The bases ag (red) correspond to the intron 10 (chromosome 19 part) splice site. Solid blue double arrows indicate the polypyrimidine tract (PPT). A) Chromosome 19 derived part of the genomic sequence of PUM1-FUS-19q-I. B) Chromosome 19 derived part of the genomic sequence of PUM1-FUS-19q-II. Black line indicates the Alu–repeat. Site of Primer 500-Cluster_PolyA_I is shown by a black arrow. Red line (PS) and red box (P) indicates predicted poly (A) signals. C) Intron 10 splice sites of the two PUM1-FUS-19q variants.

References

    1. DeLellis RA. Lyon: IARC Press; 2004. Pathology and genetics of tumours of endocrine organs: [… editorial and consensus conference in Lyon, France, April 23 - 26, 2003]. 320 S. p.
    1. Belge G, Roque L, Soares J, Bruckmann S, Thode B, et al. Cytogenetic investigations of 340 thyroid hyperplasias and adenomas revealing correlations between cytogenetic findings and histology. Cancer Genet Cytogenet. 1998;101:42–48. - PubMed
    1. Belge G, Rippe V, Meiboom M, Drieschner N, Garcia E, et al. Delineation of a 150-kb breakpoint cluster in benign thyroid tumors with 19q13.4 aberrations. Cytogenet Cell Genet. 2001;93:48–51. - PubMed
    1. Bortolin-Cavaille ML, Dance M, Weber M, Cavaille J. C19MC microRNAs are processed from introns of large Pol-II, non-protein-coding transcripts. Nucleic Acids Res. 2009;37:3464–3473. - PMC - PubMed
    1. Ren J, Jin P, Wang E, Marincola FM, Stroncek DF. MicroRNA and gene expression patterns in the differentiation of human embryonic stem cells. J Transl Med. 2009;7:20. - PMC - PubMed

Publication types

MeSH terms

Associated data