

Loss of the actin remodeler Eps8 causes intestinal defects and improved metabolic status in mice
- PMID: 20209148
- PMCID: PMC2830459
- DOI: 10.1371/journal.pone.0009468
Loss of the actin remodeler Eps8 causes intestinal defects and improved metabolic status in mice
Abstract
Background: In a variety of organisms, including mammals, caloric restriction improves metabolic status and lowers the incidence of chronic-degenerative diseases, ultimately leading to increased lifespan.
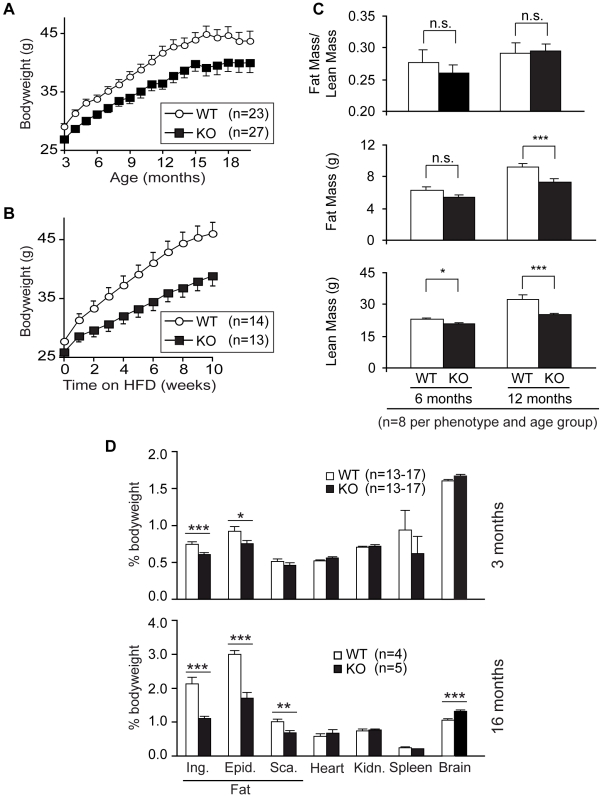
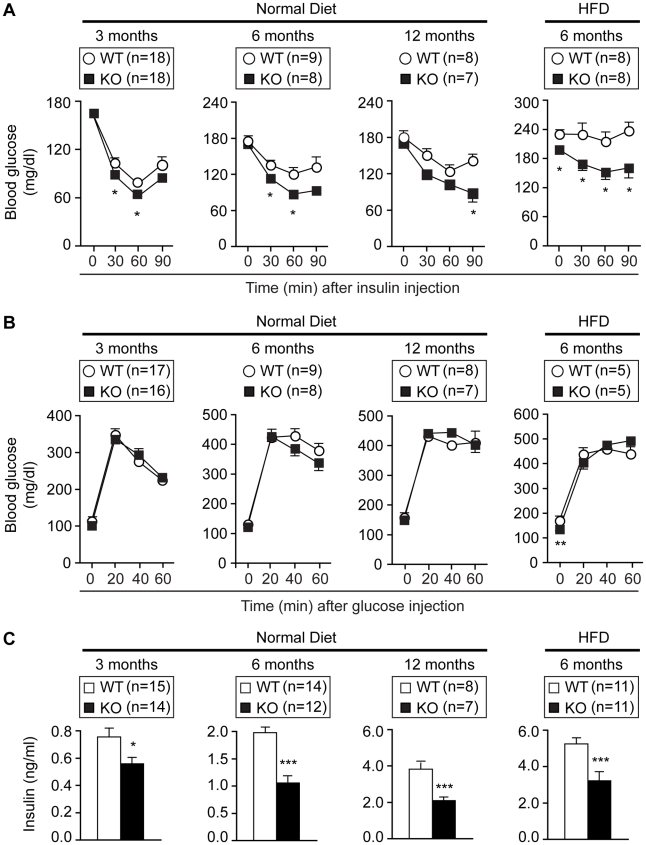
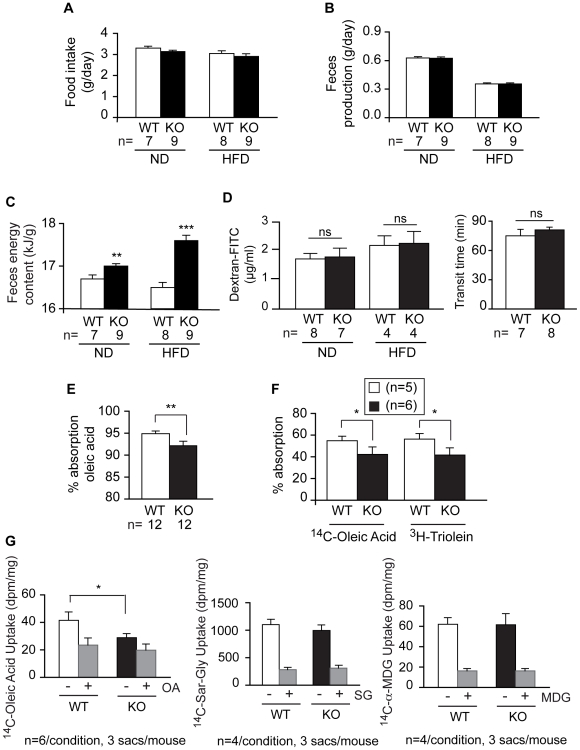
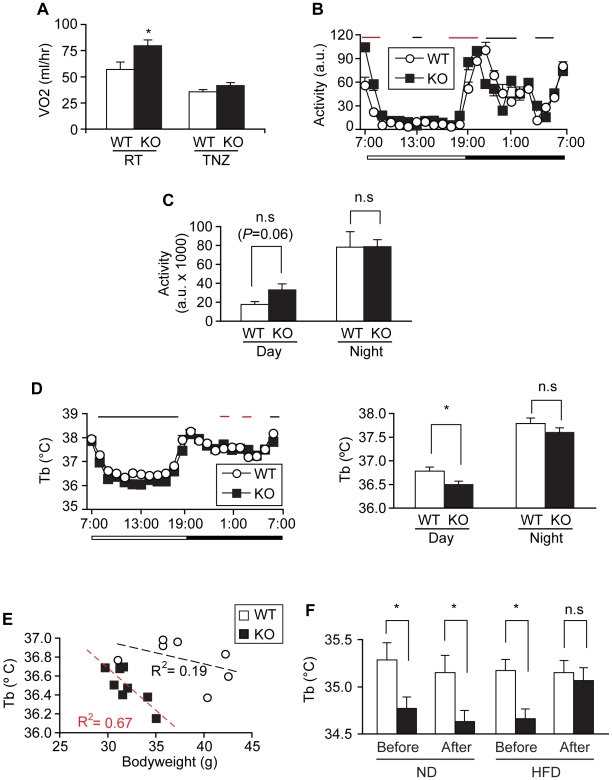
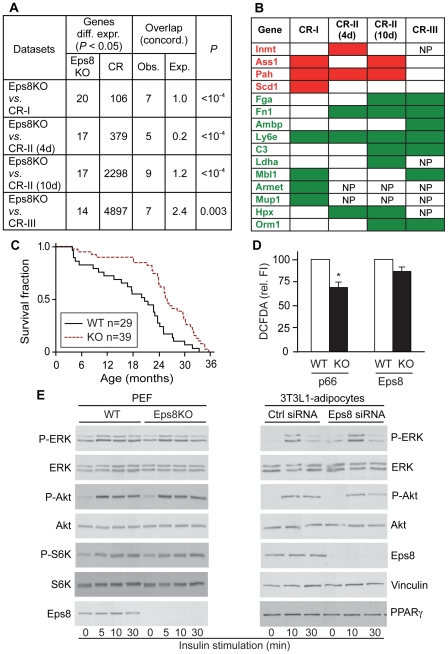
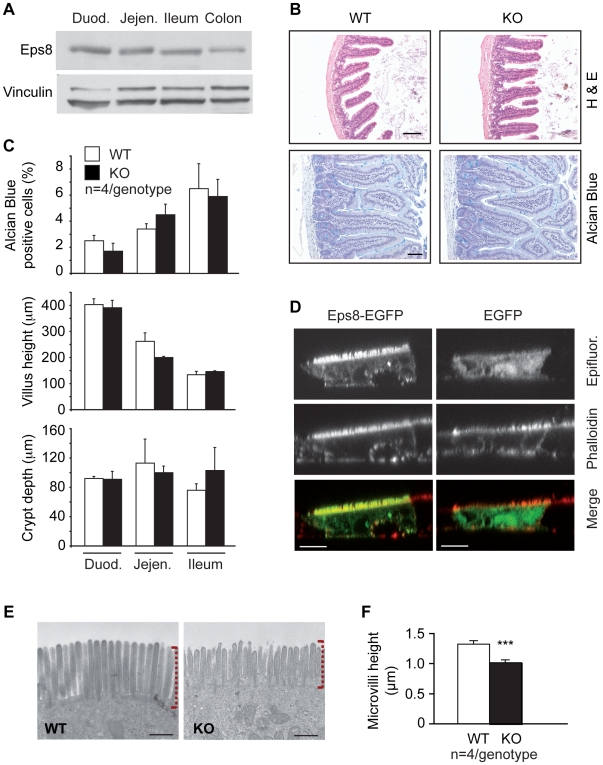
Methodology/principal findings: Here we show that knockout mice for Eps8, a regulator of actin dynamics, display reduced body weight, partial resistance to age- or diet-induced obesity, and overall improved metabolic status. Alteration in the liver gene expression profile, in behavior and metabolism point to a calorie restriction-like phenotype in Eps8 knockout mice. Additionally, and consistent with a calorie restricted metabolism, Eps8 knockout mice show increased lifespan. The metabolic alterations in Eps8 knockout mice correlated with a significant reduction in intestinal fat absorption presumably caused by a 25% reduction in intestinal microvilli length.
Conclusions/significance: Our findings implicate actin dynamics as a novel variable in the determination of longevity. Additionally, our observations suggest that subtle differences in energy balance can, over time, significantly affect bodyweight and metabolic status in mice.
Conflict of interest statement
Figures
Similar articles
-
Increased ethanol resistance and consumption in Eps8 knockout mice correlates with altered actin dynamics.Cell. 2006 Oct 6;127(1):213-26. doi: 10.1016/j.cell.2006.09.011. Cell. 2006. PMID: 17018287
-
A novel actin barbed-end-capping activity in EPS-8 regulates apical morphogenesis in intestinal cells of Caenorhabditis elegans.Nat Cell Biol. 2004 Dec;6(12):1173-9. doi: 10.1038/ncb1198. Epub 2004 Nov 21. Nat Cell Biol. 2004. PMID: 15558032
-
IRSp53/Eps8 complex is important for positive regulation of Rac and cancer cell motility/invasiveness.Cancer Res. 2004 Aug 1;64(15):5237-44. doi: 10.1158/0008-5472.CAN-04-0327. Cancer Res. 2004. PMID: 15289329
-
Eps8 controls actin-based motility by capping the barbed ends of actin filaments.Nat Cell Biol. 2004 Dec;6(12):1180-8. doi: 10.1038/ncb1199. Epub 2004 Nov 21. Nat Cell Biol. 2004. PMID: 15558031
-
Blocking dopamine D2 receptors by haloperidol curtails the beneficial impact of calorie restriction on the metabolic phenotype of high-fat diet induced obese mice.J Neuroendocrinol. 2011 Feb;23(2):158-67. doi: 10.1111/j.1365-2826.2010.02092.x. J Neuroendocrinol. 2011. PMID: 21062378
Cited by
-
Eps8 controls dendritic spine density and synaptic plasticity through its actin-capping activity.EMBO J. 2013 Jun 12;32(12):1730-44. doi: 10.1038/emboj.2013.107. Epub 2013 May 17. EMBO J. 2013. PMID: 23685357 Free PMC article.
-
Progressive hearing loss and gradual deterioration of sensory hair bundles in the ears of mice lacking the actin-binding protein Eps8L2.Proc Natl Acad Sci U S A. 2013 Aug 20;110(34):13898-903. doi: 10.1073/pnas.1304644110. Epub 2013 Aug 5. Proc Natl Acad Sci U S A. 2013. PMID: 23918390 Free PMC article.
-
BioID2 screening identifies KIAA1671 as an EPS8 proximal factor that marks sites of microvillus growth.Mol Biol Cell. 2023 Apr 1;34(4):ar31. doi: 10.1091/mbc.E22-11-0498. Epub 2023 Feb 15. Mol Biol Cell. 2023. PMID: 36790915 Free PMC article.
-
Intestinal Morphogenesis in Development, Regeneration, and Disease: The Potential Utility of Intestinal Organoids for Studying Compartmentalization of the Crypt-Villus Structure.Front Cell Dev Biol. 2020 Oct 23;8:593969. doi: 10.3389/fcell.2020.593969. eCollection 2020. Front Cell Dev Biol. 2020. PMID: 33195268 Free PMC article. Review.
-
The actin-binding protein EPS8 binds VE-cadherin and modulates YAP localization and signaling.J Cell Biol. 2015 Dec 21;211(6):1177-92. doi: 10.1083/jcb.201501089. Epub 2015 Dec 14. J Cell Biol. 2015. PMID: 26668327 Free PMC article.
References
-
- Berg AH, Scherer PE. Adipose tissue, inflammation, and cardiovascular disease. Circ Res. 2005;96:939–949. - PubMed
-
- Hauner H. The new concept of adipose tissue function. Physiol Behav. 2004;83:653–658. - PubMed
-
- Marshall S. Role of insulin, adipocyte hormones, and nutrient-sensing pathways in regulating fuel metabolism and energy homeostasis: a nutritional perspective of diabetes, obesity, and cancer. Sci STKE. 2006;2006:re7. - PubMed
-
- Bluher M, Michael MD, Peroni OD, Ueki K, Carter N, et al. Adipose tissue selective insulin receptor knockout protects against obesity and obesity-related glucose intolerance. Dev Cell. 2002;3:25–38. - PubMed
-
- Bluher M, Kahn BB, Kahn CR. Extended longevity in mice lacking the insulin receptor in adipose tissue. Science. 2003;299:572–574. - PubMed
