

Review
doi: 10.1021/cr900266s.
In vivo photoacoustic tomography of chemicals: high-resolution functional and molecular optical imaging at new depths
Affiliations
- PMID: 20210338
- PMCID: PMC2872199
- DOI: 10.1021/cr900266s
Item in Clipboard
Review
In vivo photoacoustic tomography of chemicals: high-resolution functional and molecular optical imaging at new depths
Chem Rev.
.
No abstract available
Figures
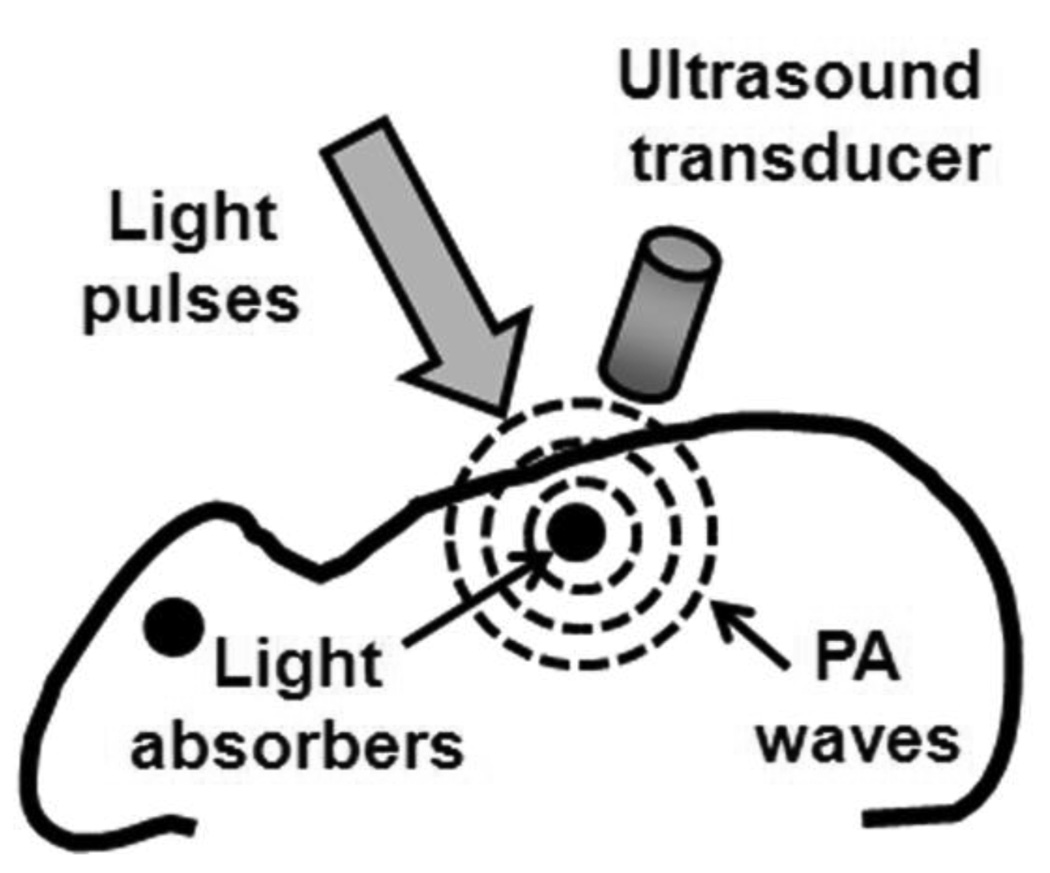
Illustration of the PA mechanism. When a target absorbs light, PA waves are generated via thermo-elastic expansion. The PA waves propagate and are detected by an ultrasonic transducer.
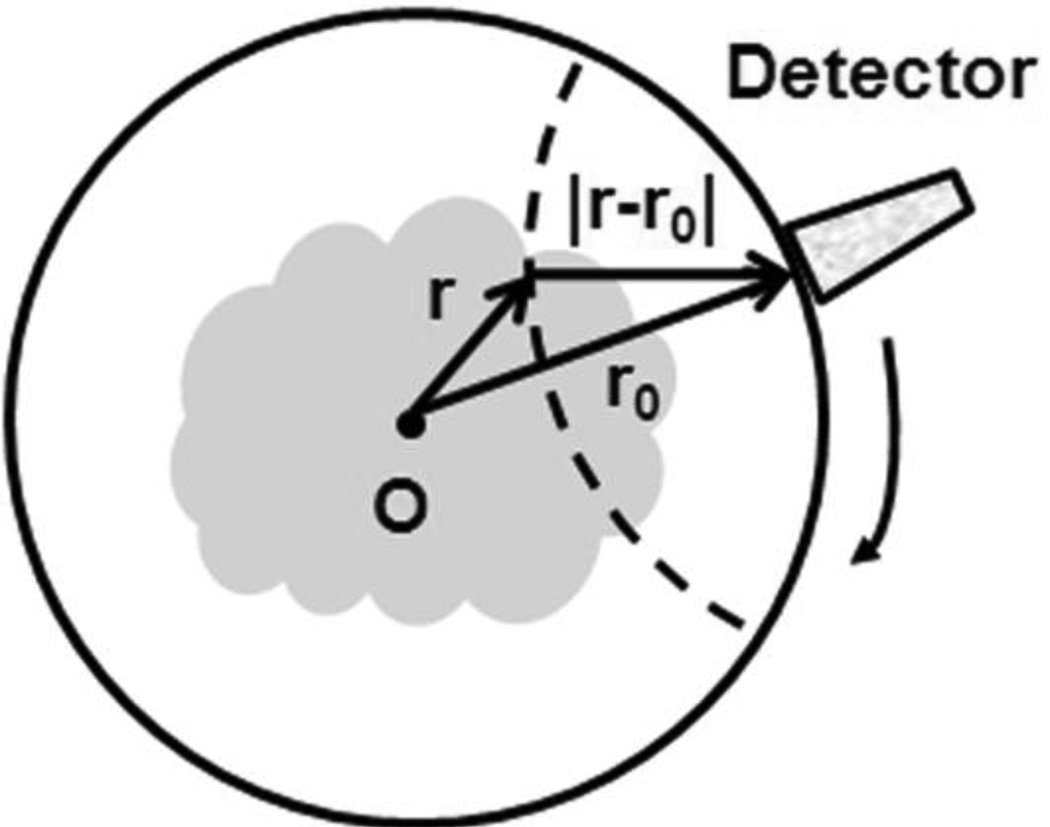
Circular scanning geometry in PACT using an unfocused ultrasound transducer.
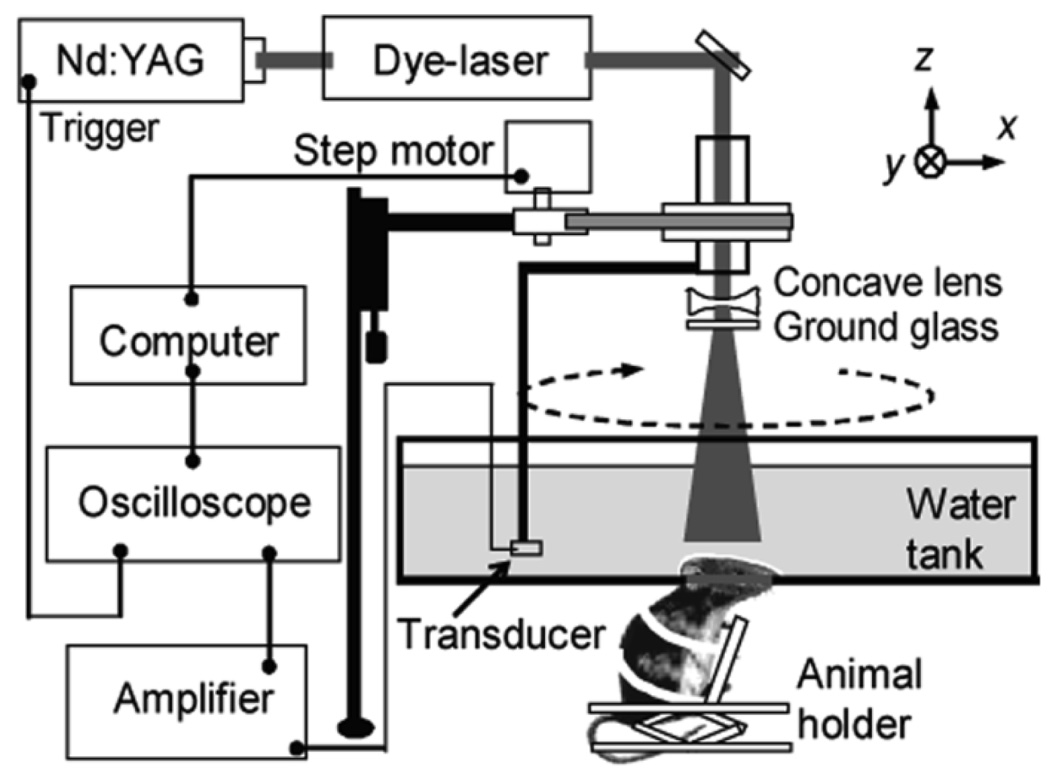
A schematic of a PACT system for small-animal brain imaging. (Reprinted with permission from ref . Copyright 2006 American Chemical Society.)
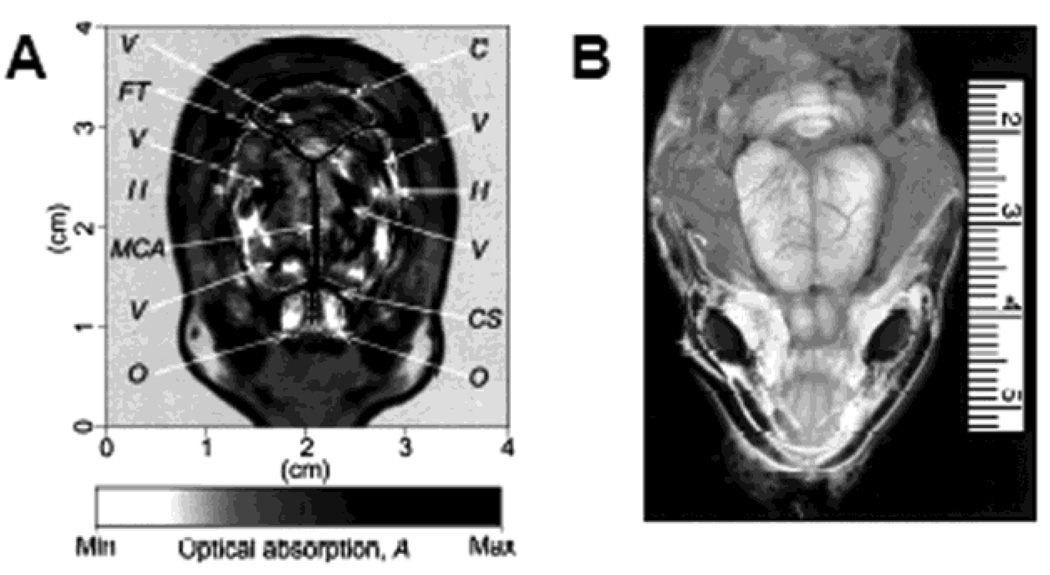
Structural PACT image of a rat brain acquired in vivo. (A) Noninvasive PACT image of a rat brain cortex acquired with the skin and skull intact. C, cerebellum; H, cerebral hemispheres; O, olfactory bulbs; MCA, middle cerebral artery; CS, cruciate sulcus; FT, fissure transversa; V, blood vessels. (B) Open-skull photograph taken after PACT experiment. (Reprinted with permission from ref . Copyright 2003 Nature.)
A schematic of 512-element, 360-degree PACT system. (Reprinted with permission from ref . Copyright 2009 The Optical Society of America.)

Time-resolved PA images of mouse brain vasculature with fast wavelength scanning. The laser wavelength was manually chirped from 710 nm to 900 nm over 30 seconds. (Reprinted with permission from ref . Copyright 2009 The Optical Society of America.)

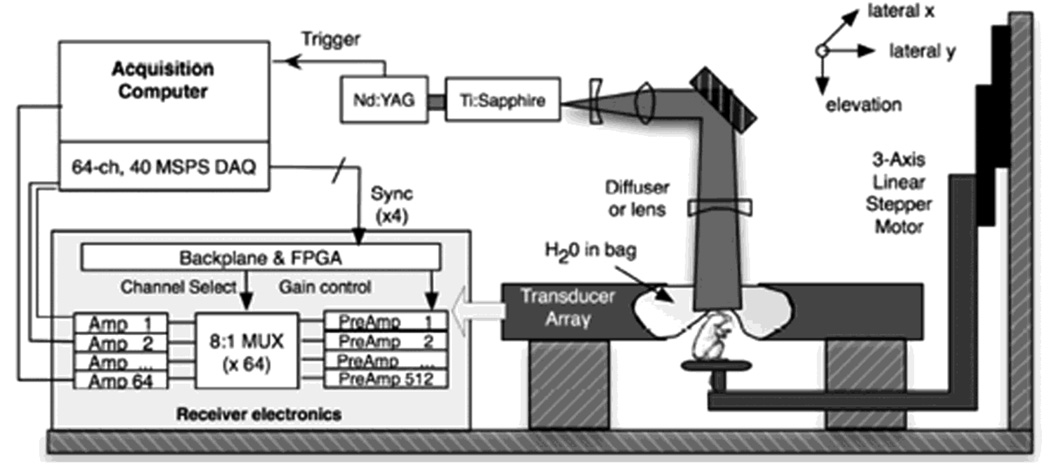
Schematic of a microscopic PACT imaging system using a linear ultrasound array. (Reprinted with permission from ref . Copyright 2008 Society of Photo-Optical Instrumentation Engineers.)
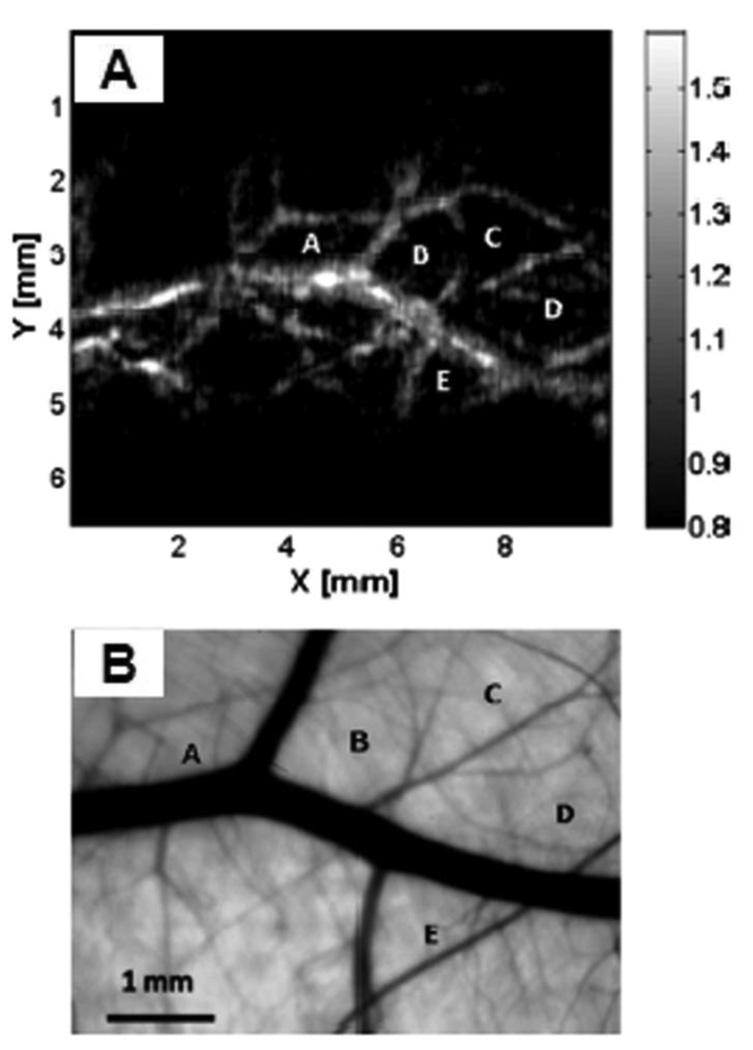
(A) In vivo noninvasive PA image of subcutaneous blood vessels in a rat using microscopic PACT with a linear ultrasound array. The regions enclosed by major blood vessels are labeled using A–E. (B) Photograph taken from the dermal side of the excised skin with transmission illumination. (Reprinted with permission from ref . Copyright 2008 Society of Photo-Optical Instrumentation Engineers.)
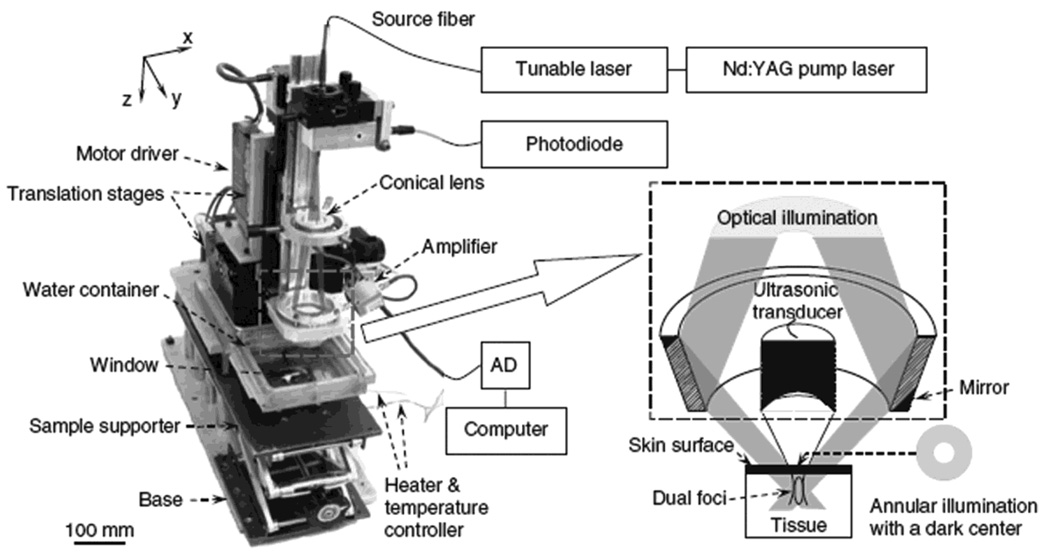
Experimental dark-field confocal PAM system. (Reprinted with permission from ref . Copyright 2006 Nature.)
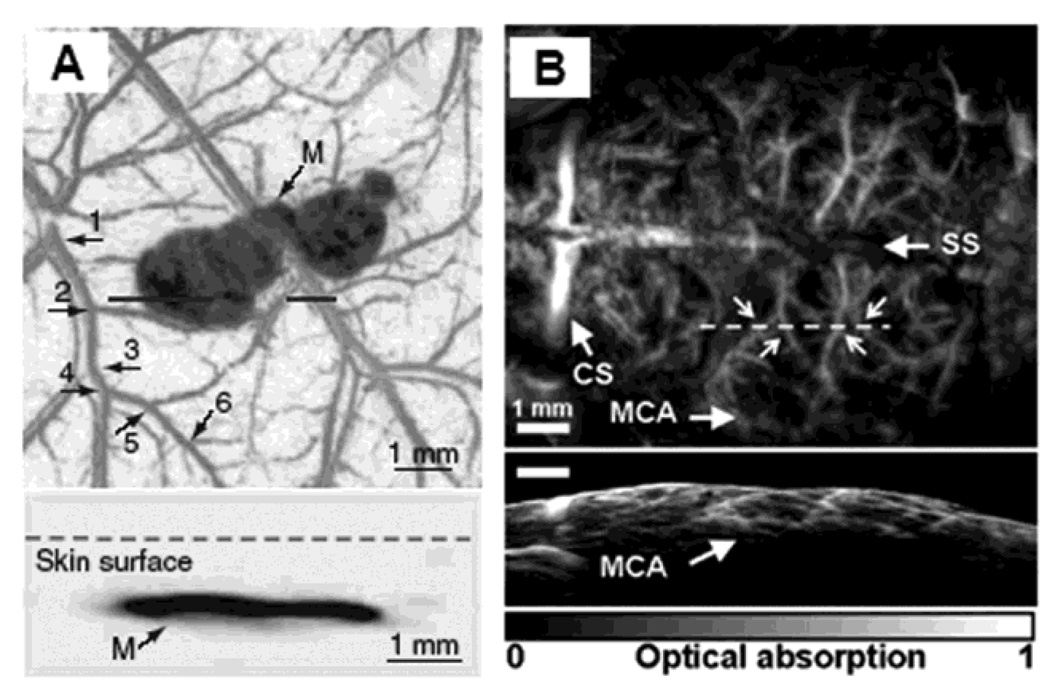
In vivo noninvasive PA images of subcutaneous microvasculature, melanoma, and cortical vasculature in mice using dark-field PAM. (A) Top: a composite image of a melanoma acquired at 764 nm and surrounding microvasculature acquired at 584 nm using a 50 MHz ultrasonic detection frequency. Bottom: a B-scan image along the cut in the corresponding top figure. M, melanoma. (B) Top: a cortical vasculature image obtained at 570 nm using a 20 MHz ultrasonic detection frequency. Bottom: a B-scan image along the cut in the corresponding top figure. SS, sagittal sinus; MCA, middle cerebral artery; CS, coronal suture. (Reprinted with permission from ref . Copyright 2006 Nature, and from ref . Copyright 2009 American Institute of Physics.)
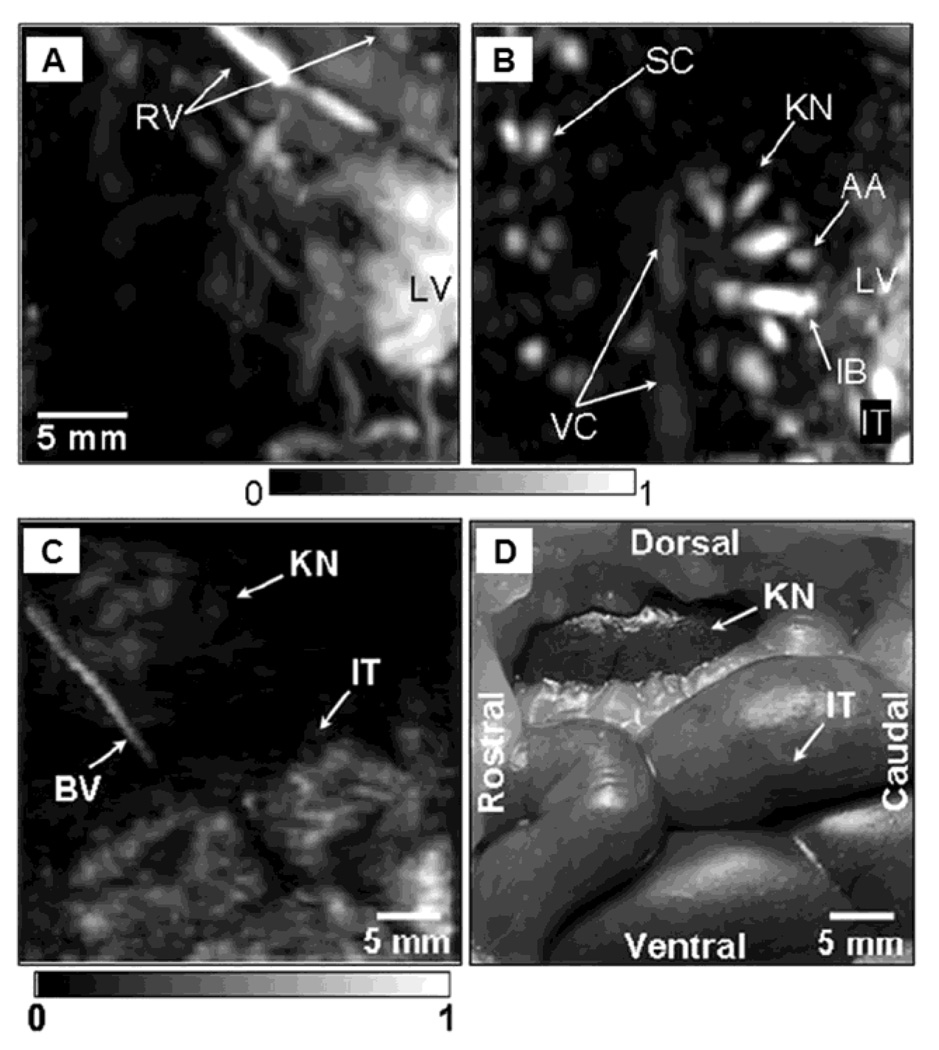
In situ noninvasive PA images of internal organs in small and large animals using deep-reflection mode PAM. PA images of liver (A) and kidney (B) in a rat. A PA images (C) of intestine in a rabbit, and the corresponding invasive photograph (D) taken after the imaging. AA, arcuate blood vessels; IB, interlobar blood vessels; IT, intestines; KN, kidney; LF, lumbodorsal fascia; LV, liver; RV, blood vessels around ribs; SC, blood vessels in the spinal cord; VC, vena cava inferior; BV, blood vessel; and IT, intestine. (Reprinted with permission from ref . Copyright 2008 The American Association of Physicists in Medicine.)

Schematic of the OR-PAM. a, Condenser lens; b, pinhole; c, microscope objective; d, ultrasonic transducer; e, correcting lens; f, isosceles prism; g, acoustic lens; h, silicon oil. (Reprinted with permission from ref . Copyright 2008 The Optical Society of America.)

OR-PAM images of microvasculature in a nude mouse ear in vivo. (A) 2D OR-PAM MAP image. (B), 3D visualization of the OR-PAM image. (C) photograph taken with transmission optical microscopy. CL, capillary, and SG, sebaceous gland. (Reprinted with permission from ref . Copyright 2008 The Optical Society of America.)
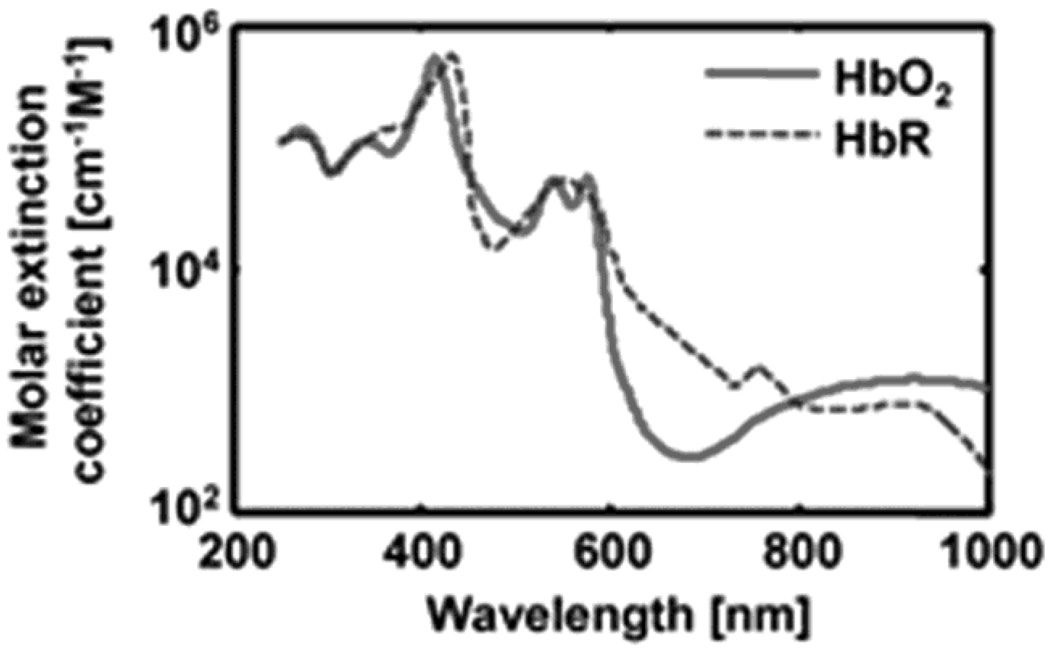
Spectra of two types of hemoglobin. Oxy-hemoglobin (HbO2) and deoxy-hemoglobin (HbR).

Static and dynamic SO2 imaging in rats’ skin. (A) Structural MAP image taken at 584 nm. (B) Static SO2 mapping. Red, arterial blood; Blue, venous blood. (C) Structural MAP image taken at 584 nm. (D) Static SO2 mapping under normoxia. Red, arterial blood; Blue, venous blood. (E) Changes in SO2 from normoxia to hypoxia. (F) Changes in SO2 from normoxia to hyperoxia. (G) Quantification of SO2 values in arteries and veins under three physiologic conditions. (Reprinted with permission from ref . Copyright 2006 Nature, and from ref . Copyright 2007 American Institute of Physics.)
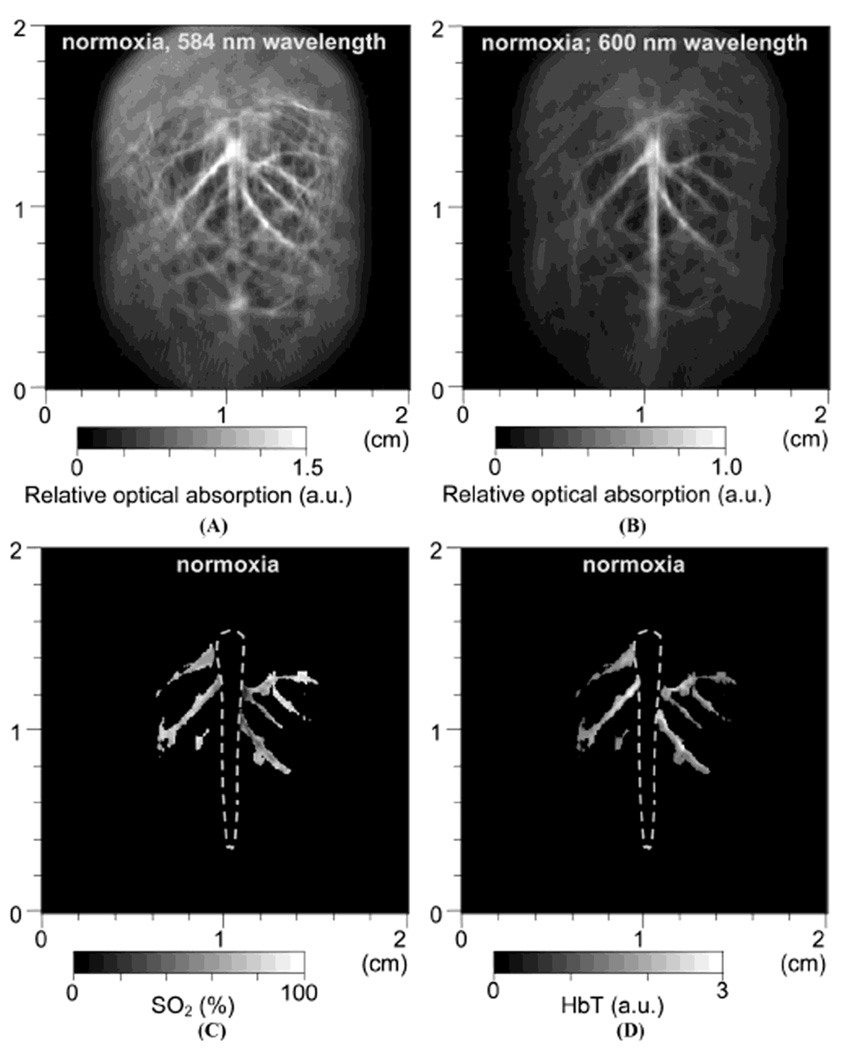
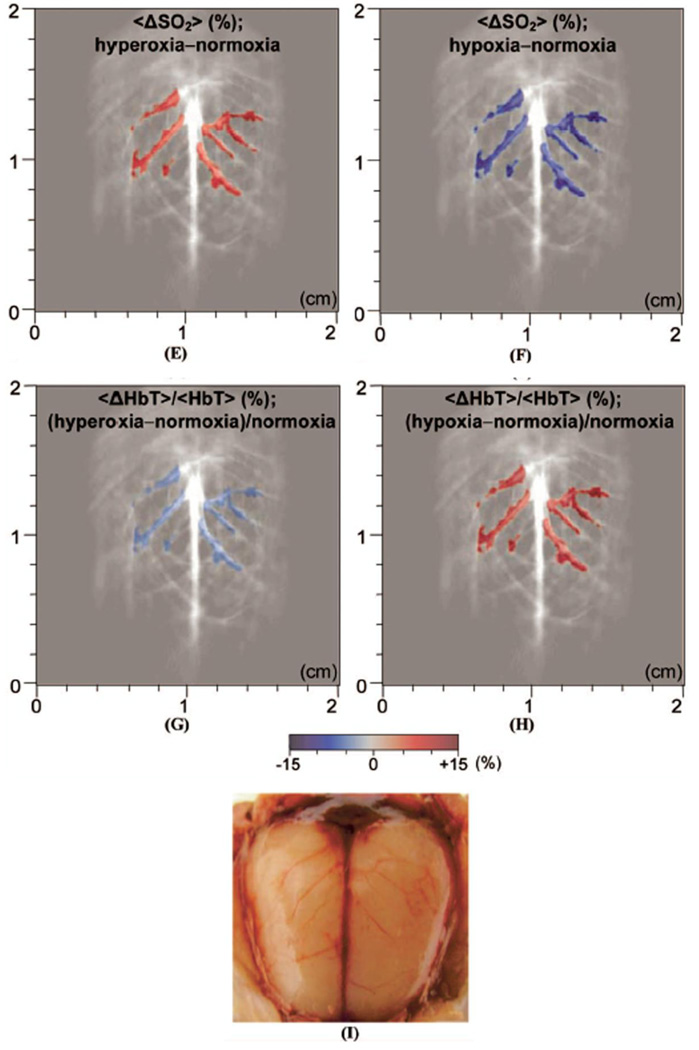
In vivo noninvasive PA images of rat brain hemodynamic changes includingtotal hemoglobin concentration (HbT) and oxygen saturation of hemoglobin (SO2). (A) and (B) Structural brain images under normoxia at 584 and 600 nm laser light, respectively. (C) and (D) Images of SO2 and HbT in the cortical venous area under normoxia. (E) The differential <SO2> (the averaged SO2 level) image between normoxia and hyperoxia (hyperoxia - normoxia). (F) The differential <SO2>image between normoxia and hypoxia (hypoxia - normoxia). (G) The fractional change in HbT (<ΔHbT>/<HbT>) between hyperoxia and normoxia. (H) The fractional change in HbT between hypoxia and normoxia. (I) Open-skull anatomical photograph taken after the PA imaging experiments. (Reprinted with permission from ref . Copyright 2006 Society of Photo-Optical Instrumentation Engineers.)
In vivo noninvasive PA images of rat brain hemodynamic changes includingtotal hemoglobin concentration (HbT) and oxygen saturation of hemoglobin (SO2). (A) and (B) Structural brain images under normoxia at 584 and 600 nm laser light, respectively. (C) and (D) Images of SO2 and HbT in the cortical venous area under normoxia. (E) The differential <SO2> (the averaged SO2 level) image between normoxia and hyperoxia (hyperoxia - normoxia). (F) The differential <SO2>image between normoxia and hypoxia (hypoxia - normoxia). (G) The fractional change in HbT (<ΔHbT>/<HbT>) between hyperoxia and normoxia. (H) The fractional change in HbT between hypoxia and normoxia. (I) Open-skull anatomical photograph taken after the PA imaging experiments. (Reprinted with permission from ref . Copyright 2006 Society of Photo-Optical Instrumentation Engineers.)

Functional PA images of cerebral hemodynamic changes in response to whisker stimulations. (A) and (B) Cerebral functional PA images in response to left and right whisker stimulation, respectively. The map of increased PA signals (color) was superimposed on the gray-scale structural PA image. (C) Open-skull photograph taken after the PA imaging experiments. B, bregma; L, lambda; M, midline; A, activated regions. (D) Histology of normal lamina IV cortical barrels (region A). (Reprinted with permission from ref . Copyright 2003 Nature.)
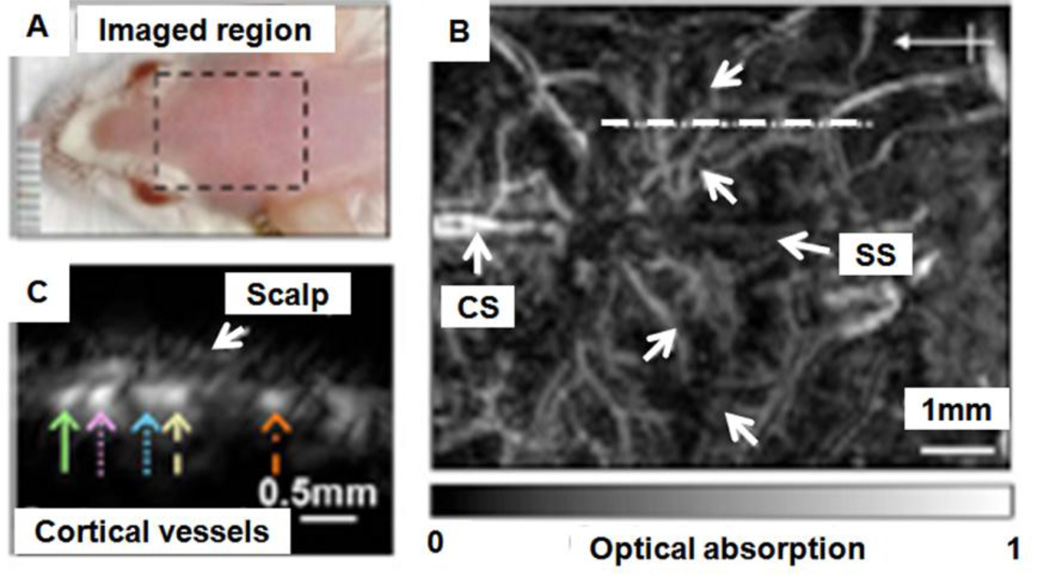
In vivo structural PA images of the mouse cortex vasculature. (A) Photograph of the scanned region. (B) Noninvasive PA image of the mouse cortex vasculature. SS, sagittal sinus; CS, coronal suture. (C) B-scan image obtained from scanning along the white dotted line in (B). (Reprinted with permission from ref . Copyright 2009 Society of Photo-Optical Instrumentation Engineers.)
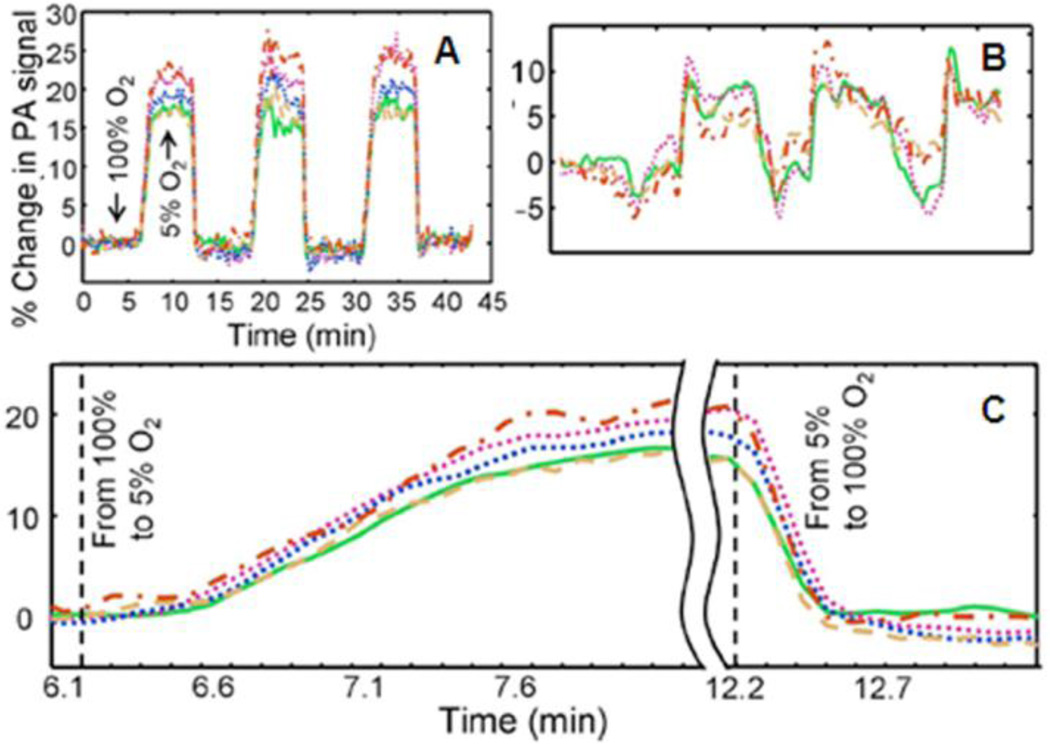
Dynamic oxygenation profiles of five vessels. Profiles acquired through a hypoxic challenge and shown in changes (%) of (A) ratiometric PA signals and (B) isosbestic PA signals. (C) Close-up of the forward rising part of the dynamic vessel responses shown in A. (Reprinted with permission from ref . Copyright 2009 Society of Photo-Optical Instrumentation Engineers.)
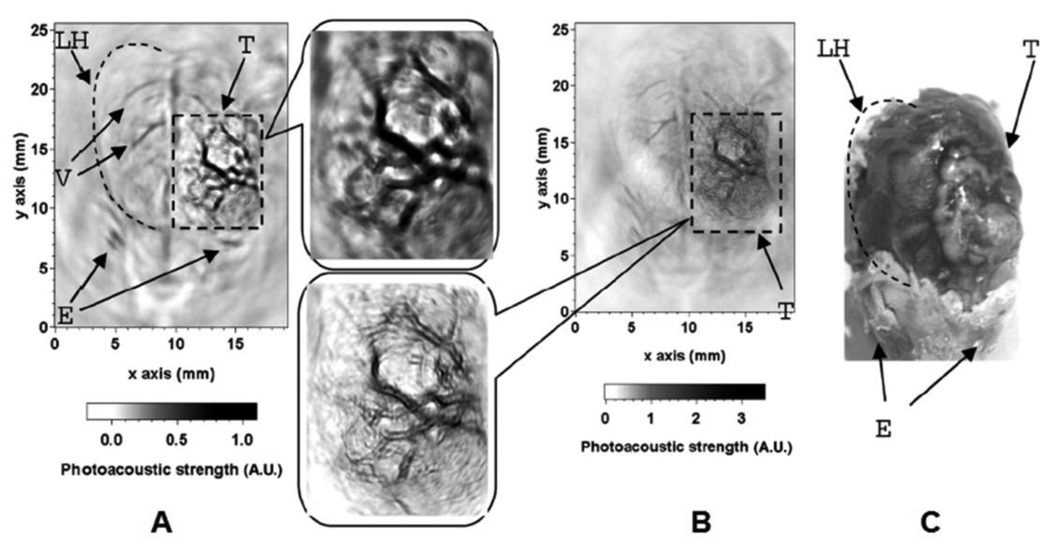
In vivo PA images of tumor angiogenesis and the corresponding close-up images in a rat brain acquired with (A) a 3.5-MHz ultrasonic transducer and (B) a 20-MHz ultrasonic transducer. (C) Photograph of the rat brain LH, left cerebral hemisphere; V, blood vessels; E, eyes; T, tumor. (Reprinted with permission from ref . Copyright 2005 The Optical Society of America.)
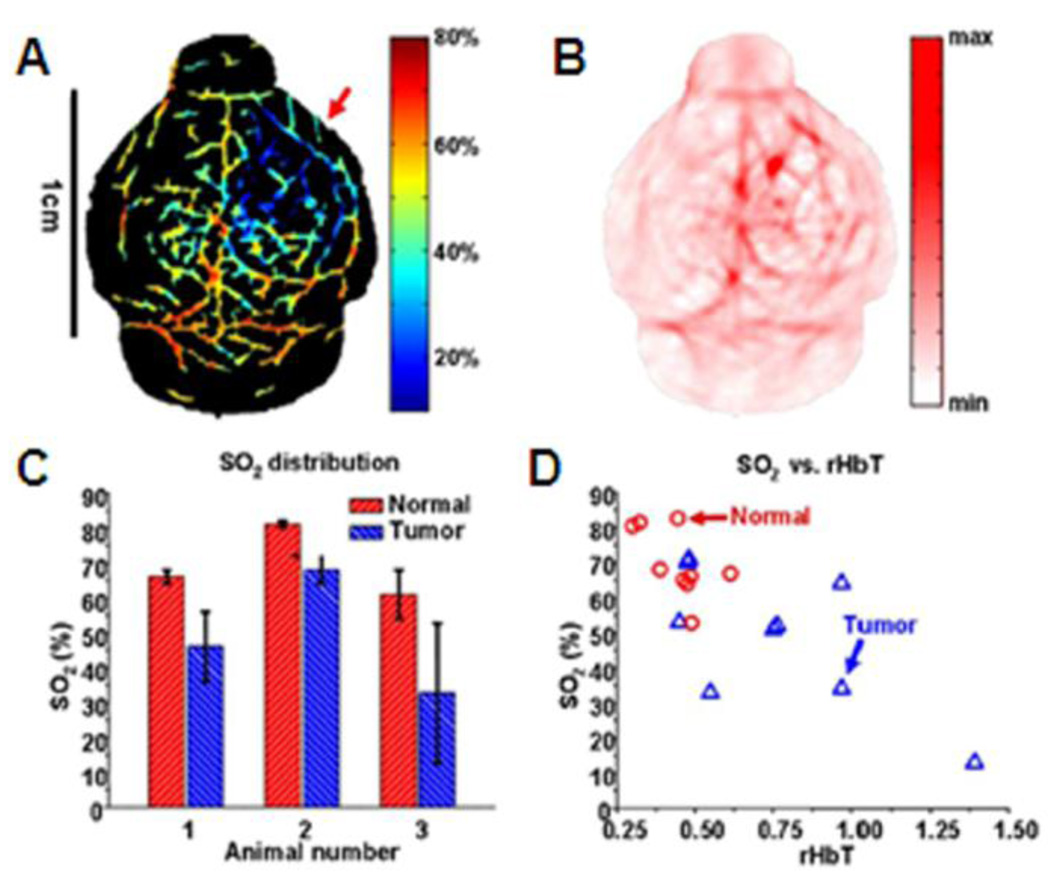
In vivo functional PA images of U87 glioblastoma xenograft in a nude mouse brain. (A) SO2 image of the nude mouse brain (Red arrow: hypoxic region). (B) HbT image of the nude mouse brain. (C) Comparison of normal and tumor vasculatures in SO2 (N = 3). (D) The SO2 versus the relative HbT in normal and tumor vasculatures. (Reprinted with permission from ref . Copyright 2008 The Institute of Electrical and Electronics Engineers, Inc.)

In vivo noninvasive OR-PAM monitoring of the healing process of a laser-induced microvascular lesion. (A) Before laser treatment. (B) Immediately after laser treatment. (C) On each of the subsequent 12 days. Left column, Photographs taken by a commercial transmission-mode optical microscope; middle column, the front view of the 3D microvascular morphology acquired by OR-PAM at 570 nm; right column, SO2 mapping of the laser-damaged region overlaid with the morphological PA image. (Reprinted with permission from ref . Copyright 2009 The American Association of Physicists in Medicine.)
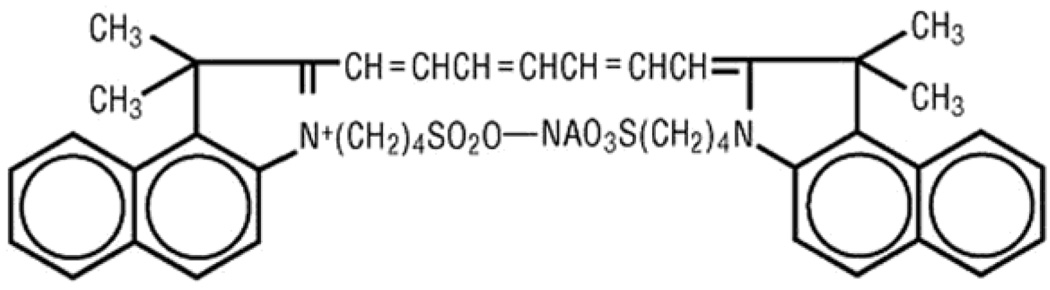
Chemical structure of ICG.
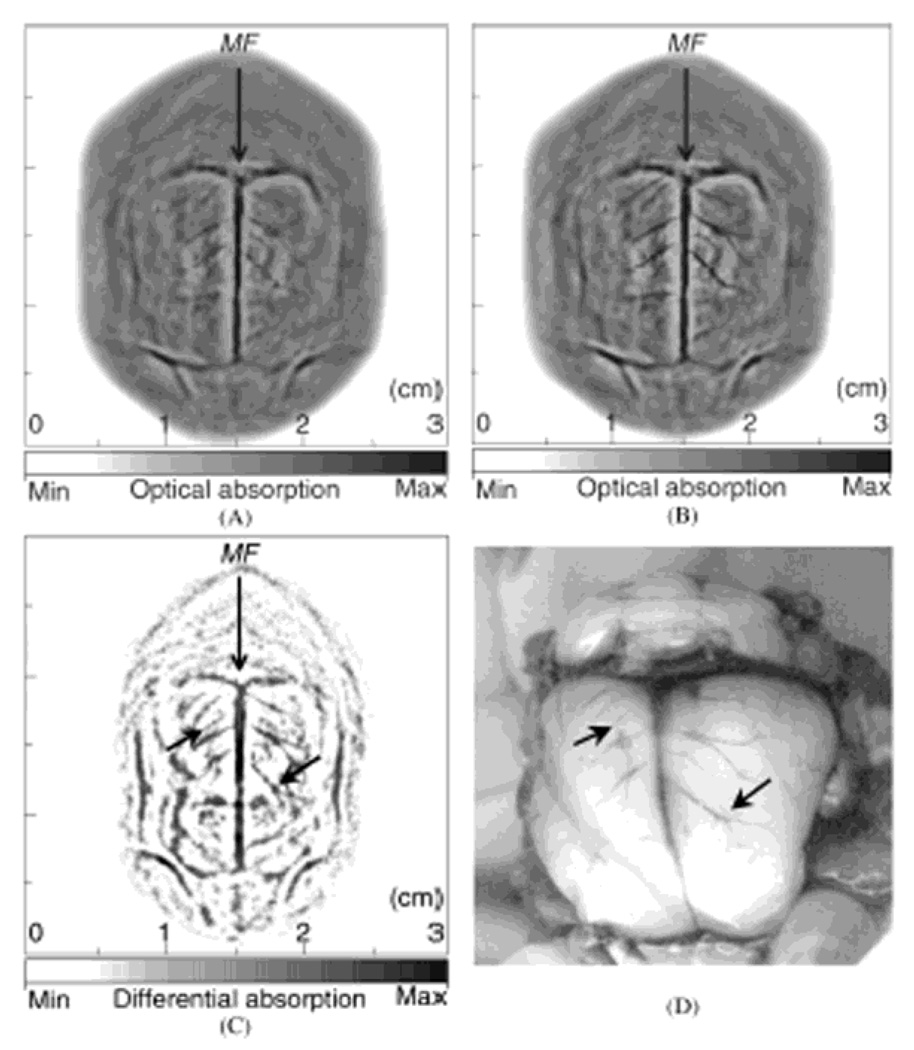
In vivo noninvasive PA images of a rat brain using ICG-PEG as contrast agents. (A) and (B) PA images obtained before and after the injection, respectively. MF, median fissure. (C) Subtracted PA image between before and after the injection (C = B - A). (D) Open-skull photograph after the PA imaging. (Reprinted with permission from ref . Copyright 2004 The Optical Society of America.)

Two-dimensional cross-sectional PA images at various depths in biological tissues. Photographs of (A) the cross section of chicken breast tissues where three pairs of tubes (whole blood, ICG in water, and ICG in blood) are embedded and (B) the entire sample. Two-dimensional PA images using a 2.25-MHz ultrasonic transducer at depths of (C) 1.3, (D) 2.6, (E) 4.2, and (F) 5.2 cm. Two-dimensional PA images at a 5.2-cm depth acquired by (G) 3.5- and (H) 5.0-MHz ultrasonic transducers. (Reprinted with permission from ref . Copyright 2005 The Optical Society of America.)
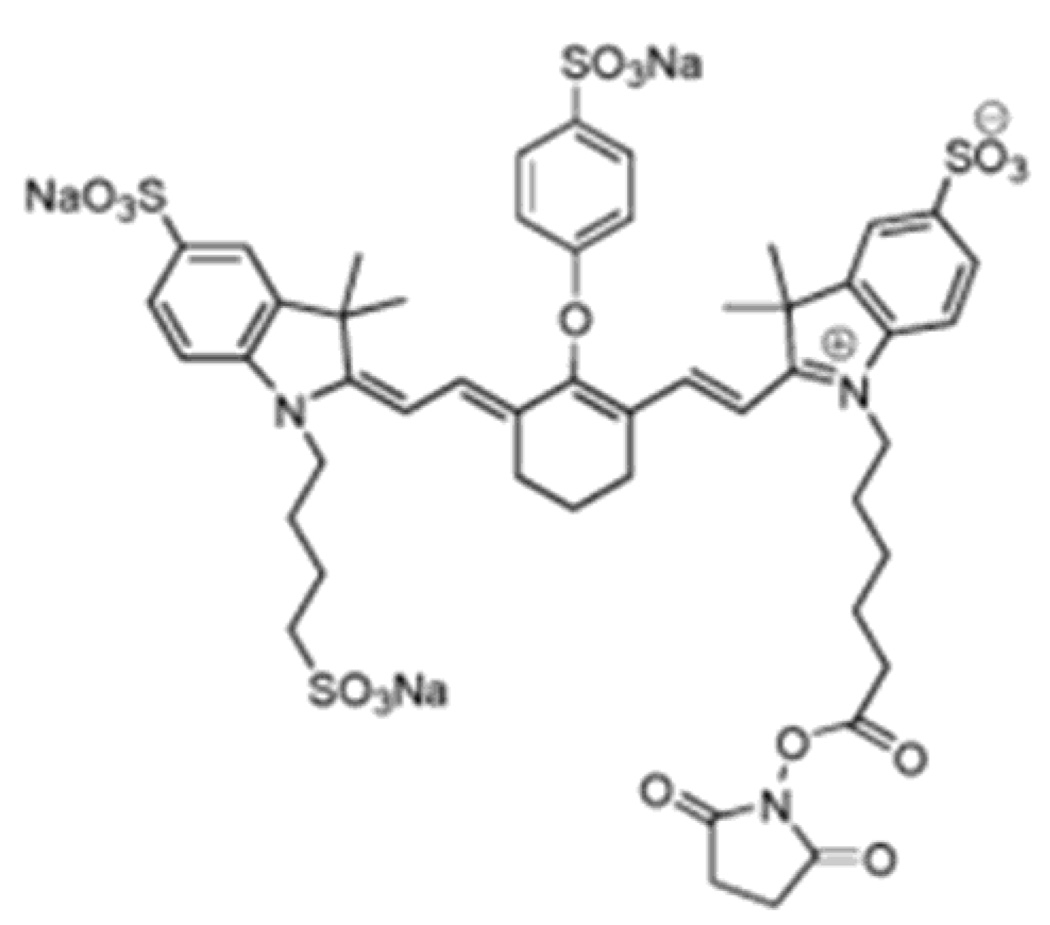
Chemical structure of IRDye800-NHS.

In vitro binding test of IRDye800-c(KRGDf) to integrin αvβ3 overexpressed U87 tumor cells. (A) Fluorescence image of IRDye800-c(KRGDf) (6 µM) incubated U87 cells for 3 min. (B) Fluorescence image of U87 cells incubated with an excess 1.2 mM of c(KRGDf) for 5 min and then followed by a 6 µM of IRDye800-c(KRGDf) for 3 min. Red: IRDye800-c(KRGDf); green: Sytox green-labeled cell nuclei. (Reprinted with permission from ref . Copyright 2008 The Institute of Electrical and Electronics Engineers, Inc.)
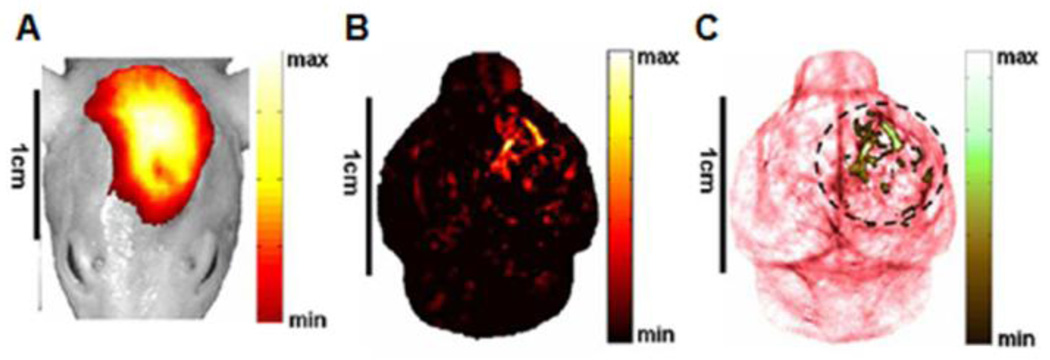
In vivo molecular PA images of a nude mouse brain with a U87 glioblastoma xenograft using IRDye800-c(KRGDf) as a molecular contrast agent. (A) A composite image of a fluorescence image and white-light photograph of the mouse head acquired 20 h after the injection. (B) In vivo molecular PA image of IRDye800-c(KRGDf). (C) A composite image of a segmented molecular and structural image, both acquired with the PACT system. (Reprinted with permission from ref . Copyright 2008 The Institute of Electrical and Electronics Engineers, Inc.)

Chemical structure of methylene blue (MB).
In vivo noninvasive PA images of the SLN in a rat. (A) Photograph with hair removed before PA imaging. (B) Photograph with skin removed after PA imaging. (C) Control image before the MB injection. (D) PA image immediately after the injection. (E) 52 min post-injection PA image with the scan head repositioned. (F) PA image of the deeply positioned (~ 18 mm) SLN. (Reprinted with permission from ref . Copyright 2008 Society of Photo-Optical Instrumentation Engineers.)
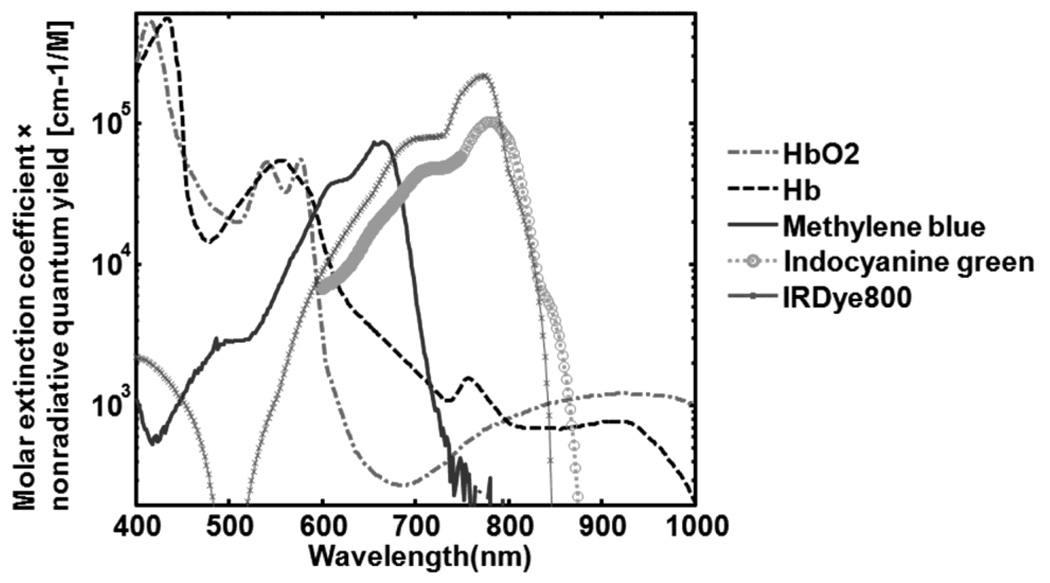
Molar extinction profiles of oxyhemoglobin (HbO2), deoxyhemoglobin (Hb), and organic dyes multiplied by nonradiative quantum yield.

(A)Transmission electron microscopy (TEM) image of 30-nm silver nanocubes synthesized with a growth time of 20 h. (B) Scanning electron microscopy (SEM) image of gold nanocages prepared with the silver cubes as a sacrificial template. The inset shows a TEM image of the same sample. (C) Extinction spectra taken from aqueous suspensions of the silver nanocubes and the corresponding gold nanocages. (D) Spectra calculated using the DDA method for a gold nanocage with the dimensions shown in the inset (extinction = absorption + scattering). (Reprinted with permission from refs ,. Copyright 2005 American Chemical Society.)

(A) Schematic illustration of the formation of immuno gold nanocages. (B) SEM image of a typical SK-BR-3 cancer cell whose surface was directly targeted by immuno gold nanocages of 36 nm in size. The inset shows an image at higher magnification (scale bar = 100 nm). (C) SEM image of a typical SK-BR-3 cell that had been incubated with PEGylated nanocages (i.e., no specific targeting), showing essentially no nanocages on the surface. (Reprinted with permission from refs ,. Copyright 2005 American Chemical Society.)
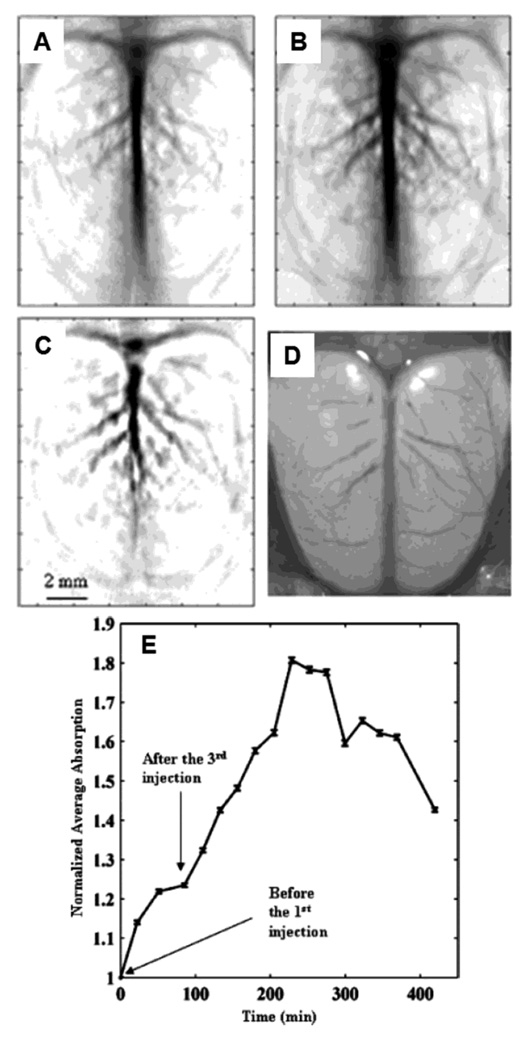
In vivo noninvasive PA images of the cerebral cortex acquired (A) before the injection, and (B) ~2 h after the final of PEGylated nanocages via tail vein. (C) A differential image (34B subtracted from 34A). (D) An open-skull photograph of the rat’s cerebral cortex. (E) Quantification of the PA signal enhancement after the injection as a function of time. (Reprinted with permission from ref . Copyright 2007 American Chemical Society.)
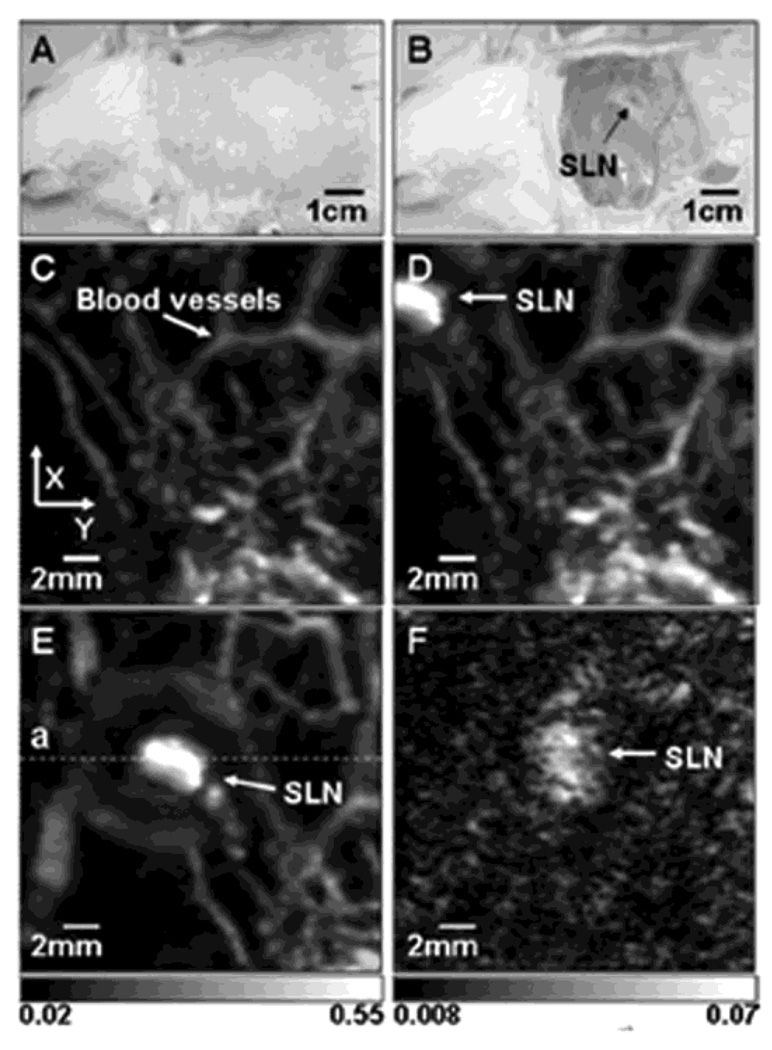
Noninvasive in vivo PA images of the SLN in a rat. (A) Photograph of axillary region with hair removed before the injection of gold nanocages. (B) Photograph with skin removed after the PA images had been captured. PA images acquired before (C) and after (D–H) the nanocage injection: (D) 5 min (SLN started to appear), (E) 59 min, (F) 140 min, (G) 194 min. (H) The increase of PA signal in the SLN as a function of time. BV, blood vessels; SLN, sentinel lymph node. (Reprinted with permission from ref . Copyright 2009 American Chemical Society.)

In vivo noninvasive PA images of the cerebral cortex acquired (A) before the injection, and (B) ~20 min after the final injection of PEGylated nanoshells via tail vein. (C) A differential image (36B subtracted from36A). (D) An open-skull photograph of the rat’s cerebral cortex showing that the PA images agreed with the location of blood vessels. (E) Quantification of the PA signal enhancement after the injection as a function of time. (Reprinted with permission from ref . Copyright 2004 American Chemical Society.)
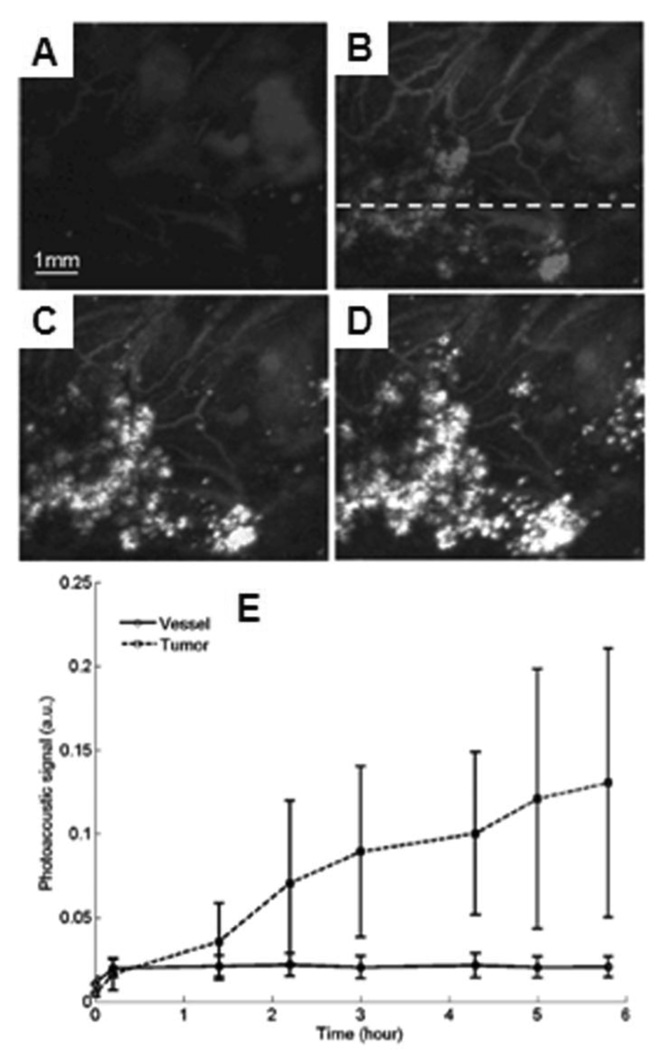
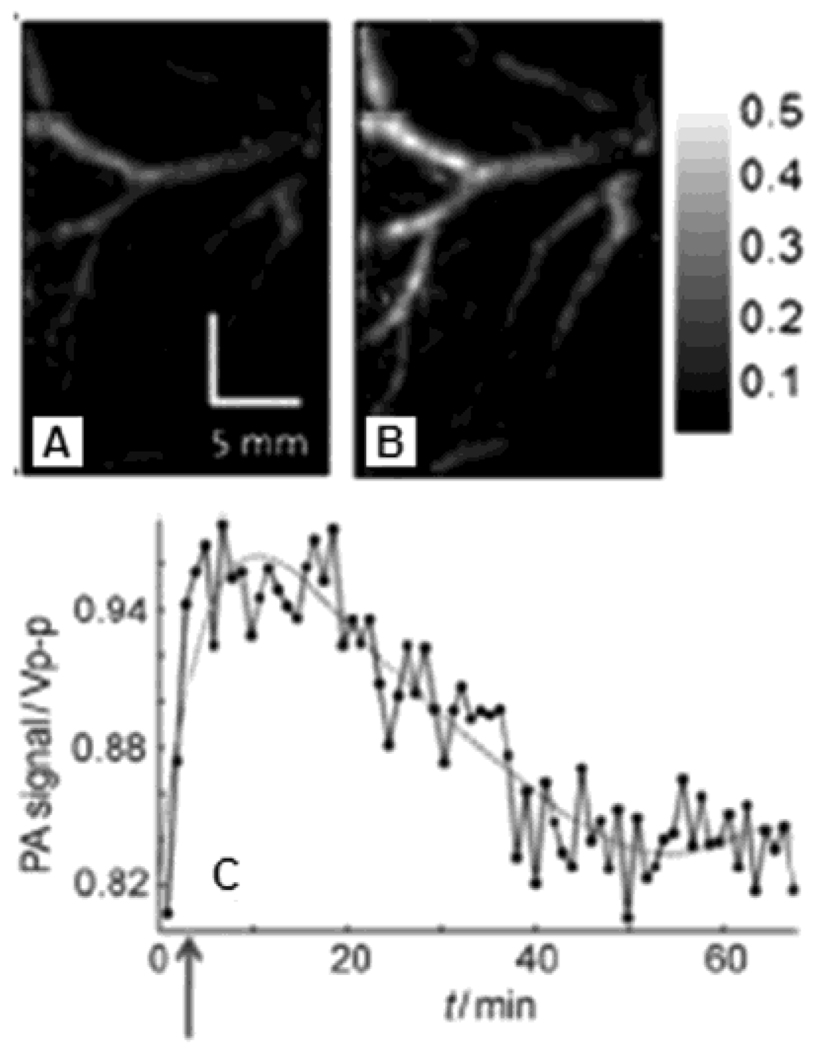
In vivo noninvasive PA images of nanoshell extravasation in a tumor. (A) Control image before the injection of nanoshells. (B), (C), and (D) PA images of accumulation of nanoshells at 1.4, 3, and 5.8 h post-injection, respectively. (E) Averaged PA signals as a function of time. Line with circles: vessel regions; dashed line with squares: tumor foci. (Reprinted with permission from ref . Copyright 2009 Society of Photo-Optical Instrumentation Engineers.)

(A) Absorbance spectra of control, targeted and non-targeted phantoms. (B), (D), and (F) PA images (λ = 532 nm) of control, targeted, and non-targeted phantoms, respectively. (C), (E), and (G) PA images (λ = 680 nm) of control, targeted, and non-targeted phantoms, respectively. (Reprinted with permission from ref . Copyright 2007 The Optical Society of America.)

PA images of (A) stimulated and (B) unstimulated ECs binding with anti-ICAM-1 conjugated gold nanorods, and (C) stimulated and (D) unstimulated ECs binding with blank gold nanorods. (Reprinted with permission from ref . Copyright 2007 American Institute of Physics.)
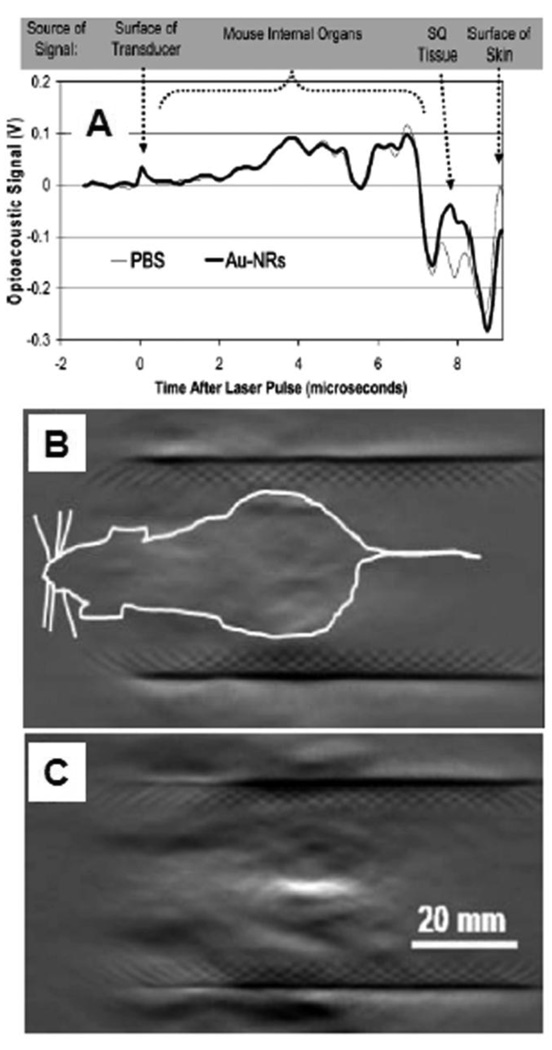
(A) In vivo noninvasive PA A-line image of a nude mouse after the injection of gold nanorods (25 µL at a concentration of 1.25 pM) or PBS (25 µL). The x-axis of (A) is the time of arrival of ultrasound. A typical PA image of a nude mouse before (B) and after (C) subcutaneous injection of 100 µL of gold nanorods at a concentration of 7.5 × 10¹⁰ nanorods/mL in the abdominal area. Injected nanoparticles were brightly visible in the PA image (C). (Reprinted with permission from ref . Copyright 2007 American Chemical Society.)

In vivo noninvasive molecular PA Images of Cal27 tumors before and after the injection of AuNR1000-EGFR and AuNR1000. Ellipses indicate the tumor regions. (A) Time-course composite of US and PA images before and after AuNR1000-EGFR injection. US image in gray scale and PA image in red pseudo-color. (B) Time-course composite of US and PA images before and after AuNR1000 injection. (C) Averaged image intensities within the tumor region as a function of time after injections of AuNR1000-EGFR (blue solid line) and AuNR1000 (red dashed line). (Reprinted with permission from ref . Copyright 2008 The Optical Society of America.)
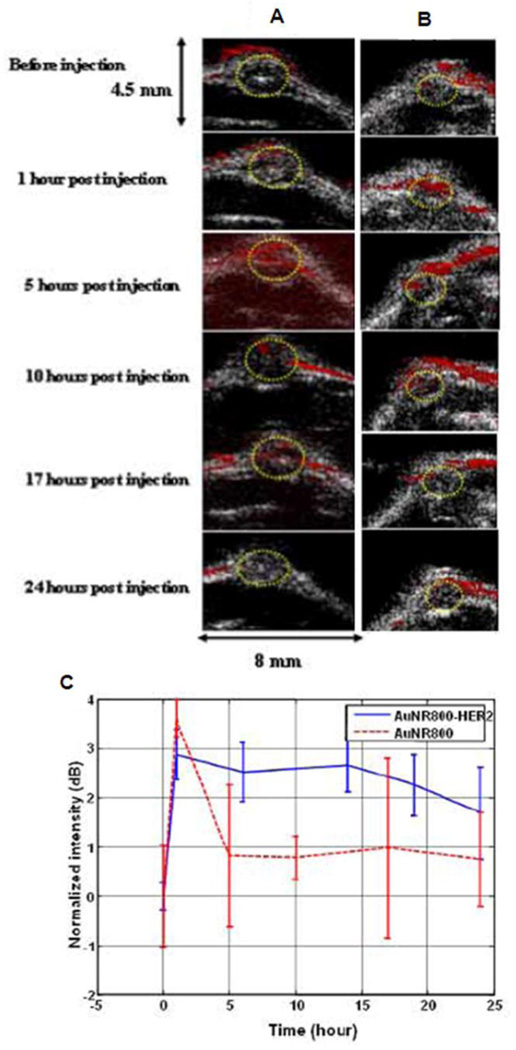
In vivo noninvasive molecular PA Images of OECM1 tumors before and after the injection of AuNR785-HER2 and AuNR785. Ellipses indicate the tumor regions. (A) Time-course composite of US and PA images before and after AuNR785-HER2 injection. US image in gray scale and PA image in red pseudo-color. (B) Time-course composite of US and PA images before and after AuNR785 injection. (C) Averaged image intensities within the tumor region as a function of time after injections of AuNR785-HER2 (blue solid line) and AuNR785 (red dashed line). (Reprinted with permission from ref . Copyright 2008 The Optical Society of America.)
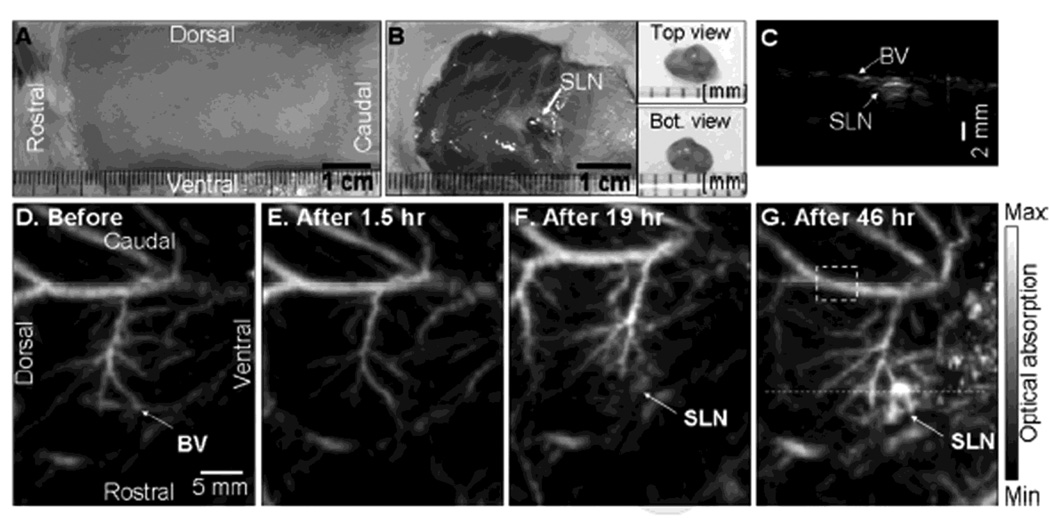
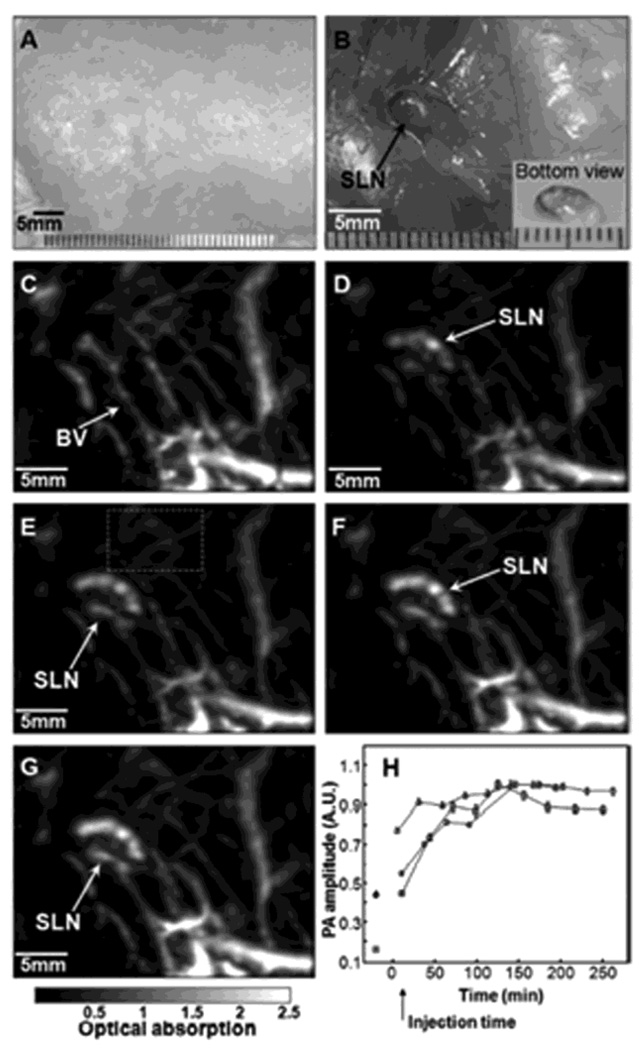
In vivo noninvasive PA images of the axilla, showing the vasculature and sentinel lymph node. (A) Photograph of the axilla with hair removed before imaging. (B) Photograph of the axilla with tissue removed. SLN is indicated by an arrow. Insets are a top view and a bottom view of the excised SLN, respectively. (C) B-scan acquired along the dotted line in (G). (D) PA image taken before the injection as a control. (E) PA image at 1.5 h post-injection. (F) PA image at 19 h injection. (G). PA image acquired at 46 h post-injection. (Reprinted with permission from ref . Copyright 2009 Elsevier.)

(A) Illustration of plain-SWNT and SWNT–RGD. (B) Photoacoustic spectra of plain-SWNT and SWNT-RGD overlaid on optical spectra of oxyhemoglobin (HbO2) and deoxyhemoblobin (Hb). (Reprinted with permission from ref . Copyright 2008 Nature.)

In vivo noninvasive molecular PA images of U87MG tumors before and after the injection of SWNTs-RGD and plain-SWNTs. The structural ultrasound image is shown in gray scale and the PA image is shown in green scale. (A) Time-course composite of US and PA images before and after SWNT-RGD and plain-SWNT. Subtraction image: PA image at 4 h post-injection – control PA image. White arrows in the left column indicate the PA signals in the mouse injected with plain-SWNT. (B) Averaged image intensities within the tumor region as a function of time after injection of SWNTs-RGD (n = 4, red solid line) and plain-SWNTs (n = 4, blue solid line). (Reprinted with permission from ref . Copyright 2008 Nature.)

In vivo noninvasive PA images of the axilla, showing the vasculature and sentinel lymph node. (A) The control PA image taken before the injection. (B) PA image taken immediate after the injection. (C) – (E) PA images at 30, 55, and 85 min post-injection, respectively. (F) The uptake kinetics of the SWNTs. (Reprinted with permission from ref . Copyright 2009 Institute of Physics.)

Preparation of gold nanobeacons from octanethiol-functionalized gold nanoparticles (AuNPs). (Reprinted with permission from ref . Copyright 2009 Wiley-VCH Verlag GmbH & Co.)
In vivo noninvasive PA vascular structural images of a rat. (A) Control PA image acquired before GNB injection. (B) PA image acquired 156 min after injection of GNBs. (C) Pharmacokinetics of GNBs in a blood vessel after injection (blue arrow: point of GNBs injection). (Reprinted with permission from ref . Copyright 2009 Wiley InterScience.)
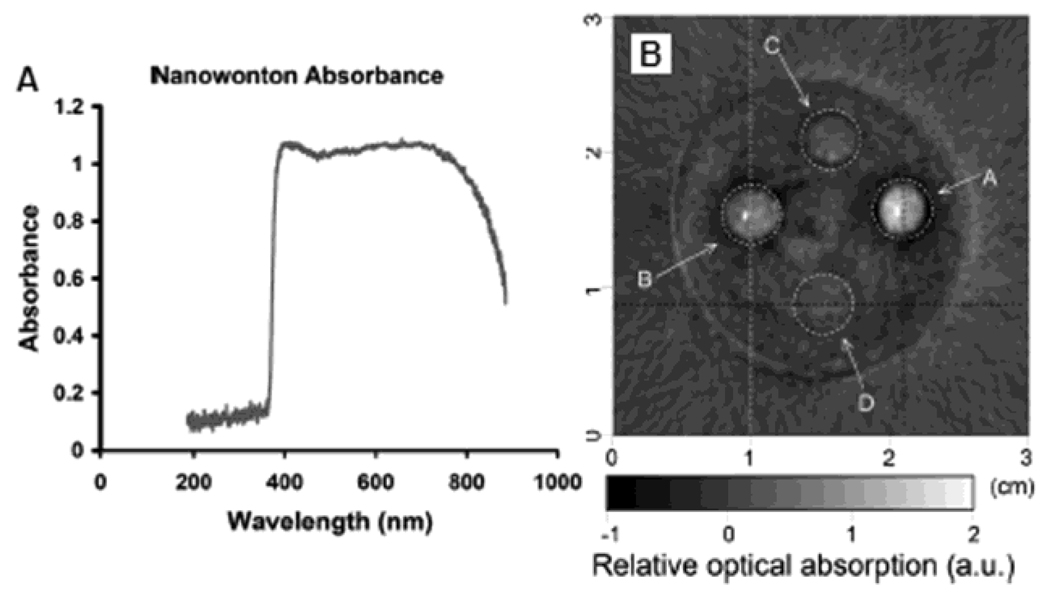
PA image of nanowonton phantom. (A) Optical absorbance of nanowontons. (B) PA image of 4 absorbing objects containing nanowonton concentrations of 100 , 50, 25, and 13 pM, respectively, for objects A, B, C, and D. (Reprinted with permission from ref . Copyright 2009 National Academy of Sciences.)
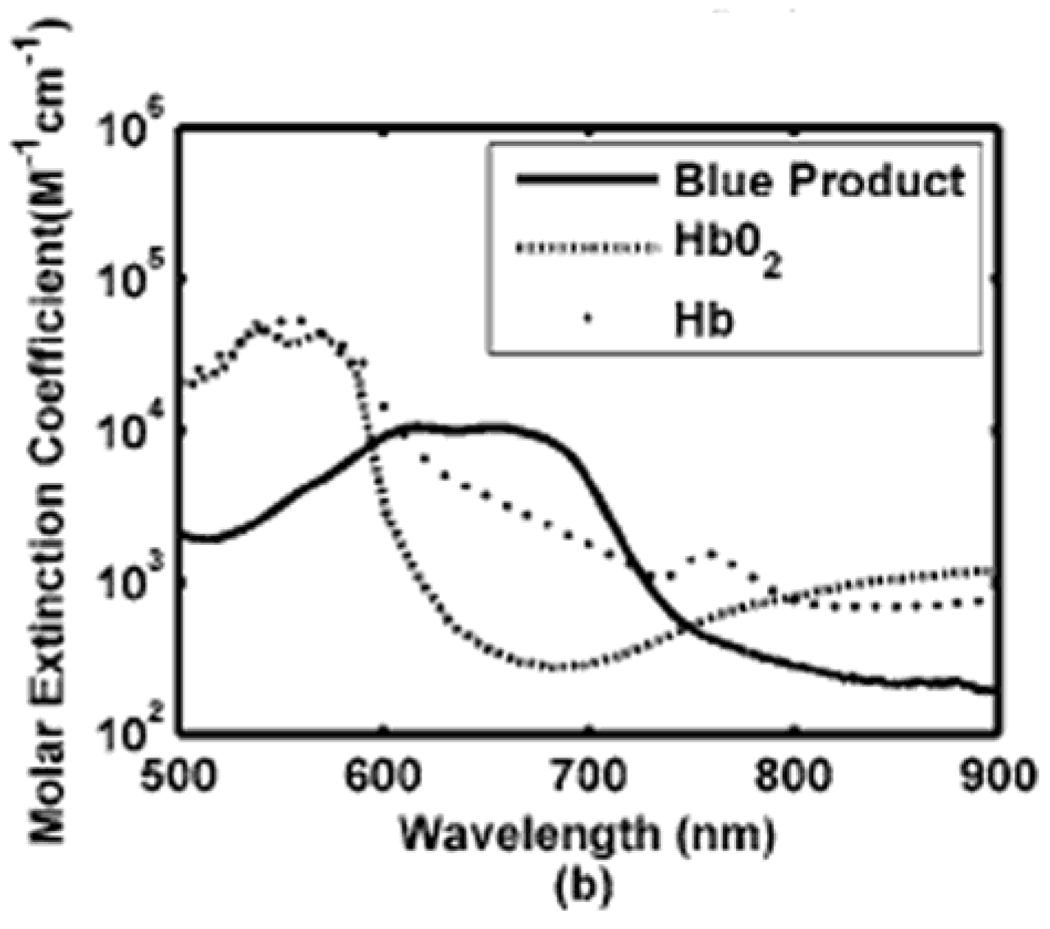
Optical spectra of the blue product, oxyhemoglobin (HbO2), and deoxyhemoglobin (Hb). (Reprinted with permission from ref . Copyright 2007 Society of Photo-Optical Instrumentation Engineers.)
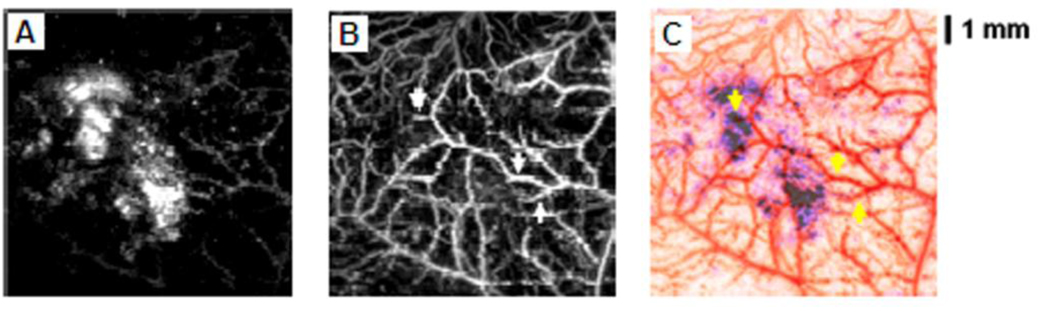
In vivo noninvasive PA mages of lacZ-marked tumor. (A) PA image acquired at 635 nm showing the tumor morphology after X-gal staining. (B) PA image acquired at 584 nm showing microvasculature. (C) A composite image of the surrounding vasculature (B) and the primary tumor (C). (Reprinted with permission from ref . Copyright 2008 World Scientific.)
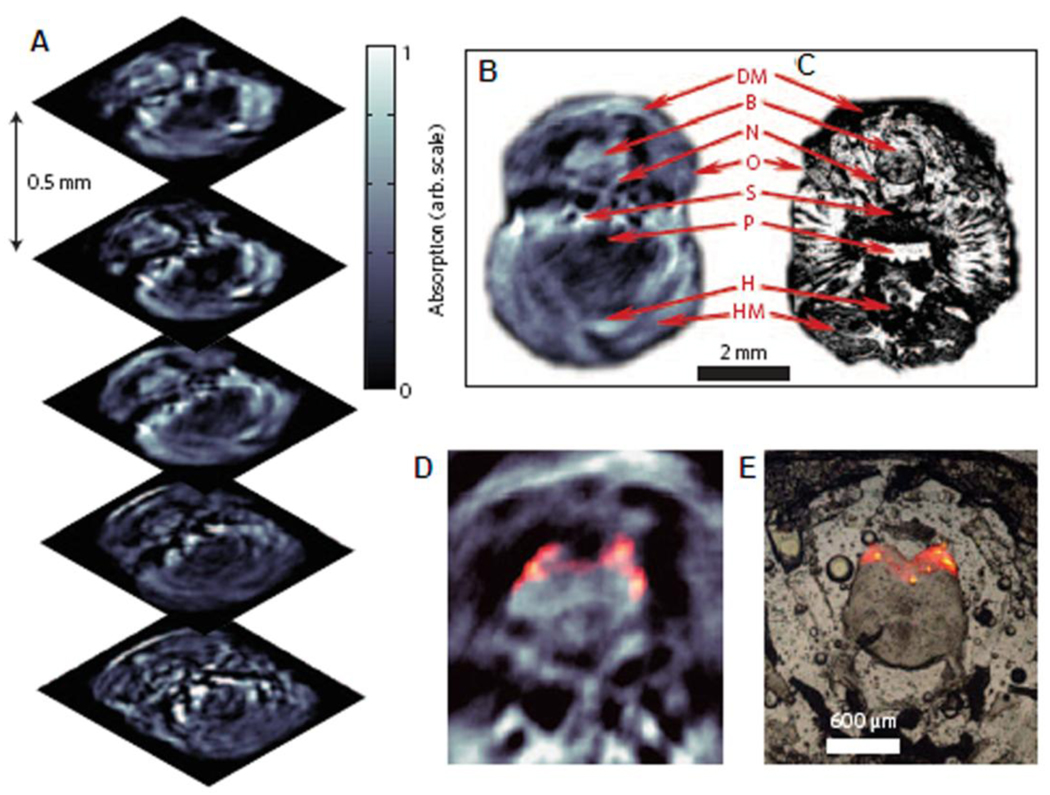
Three-dimensional in vivo PA images of the brain of an adult mCherry-expressing transgenic zebrafish. (A) Five transverse PA images taken at 585 nm. (B) A PA image and (C) its corresponding histological section. DM, dorsal fin musculature; B, hindbrain; N, lateral line nerve; O, operculum; S, skull bones; P, pharynx; H, heart; HM, hypobranchial musculature. (D) PA image of the brain with mCherry expression. (E) Corresponding fluorescent histology of a dissected brain. (Reprinted with permission from ref . Copyright 2009 Nature.)
References
-
- Bell AG. Am. J. Sci. 1880;20:305.
-
- Denk W, Strickler JH, Webb WW. Science. 1990;248:73. - PubMed
-
- Singh A, Gopinathan KP. Curr. Sci. India. 1998;74:841.
Publication types
MeSH terms
Substances
Grants and funding
LinkOut - more resources
Full Text Sources
Other Literature Sources
