

Spectral imaging reveals microvessel physiology and function from anastomoses to thromboses
- PMID: 20210437
- PMCID: PMC2917463
- DOI: 10.1117/1.3316299
Spectral imaging reveals microvessel physiology and function from anastomoses to thromboses
Abstract
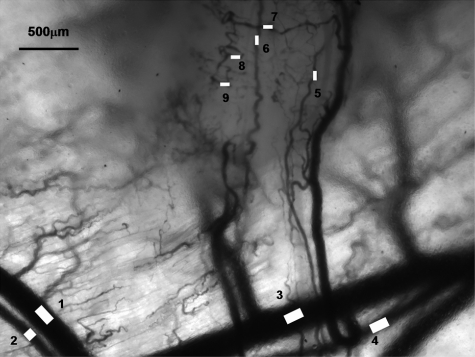
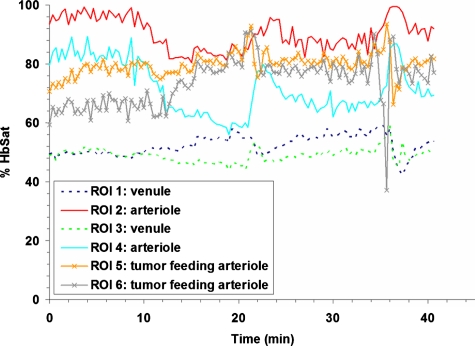
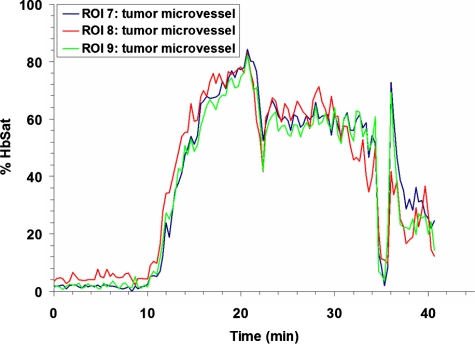
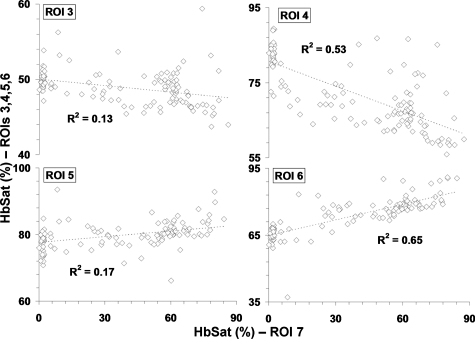
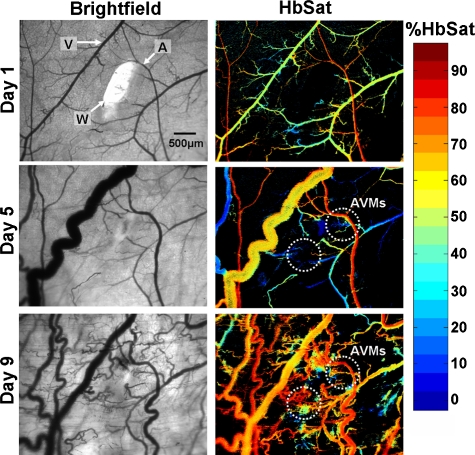
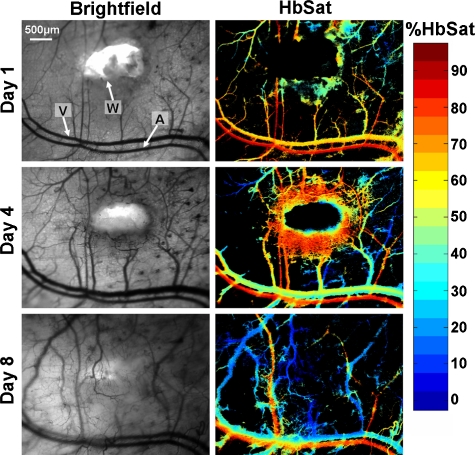
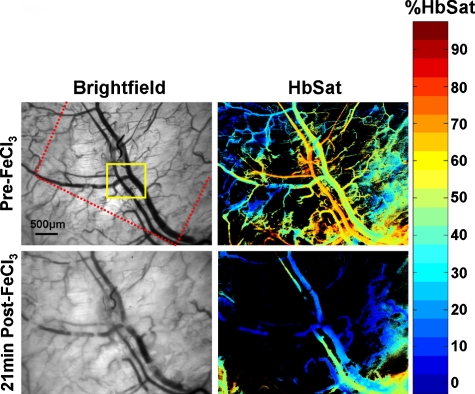
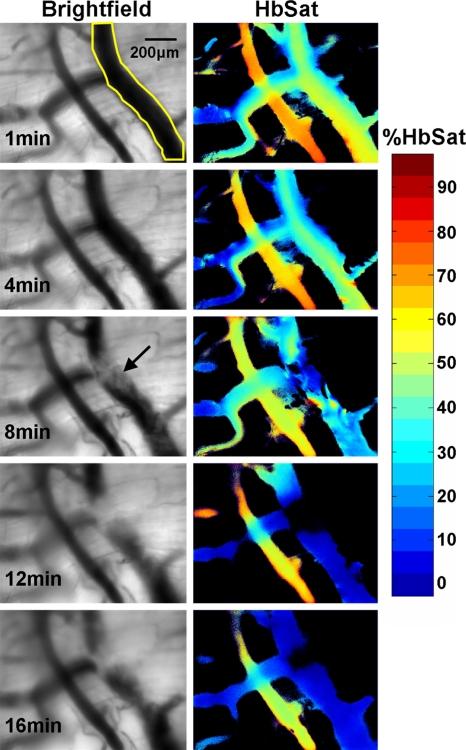
Abnormal microvascular physiology and function is common in many diseases. Numerous pathologies include hypervascularity, aberrant angiogenesis, or abnormal vascular remodeling among the characteristic features of the disease, and quantitative imaging and measurement of microvessel function can be important to increase understanding of these diseases. Several optical techniques are useful for direct imaging of microvascular function. Spectral imaging is one such technique that can be used to assess microvascular oxygen transport function with high spatial and temporal resolution in microvessel networks through measurements of hemoglobin saturation. We highlight novel observation made with our intravital microscopy spectral imaging system employed with mouse dorsal skin-fold window chambers for imaging hemoglobin saturation in microvessel networks. Specifically, we image acute oxygenation fluctuations in a tumor microvessel network, the development of arteriovenous malformations in a mouse model of hereditary hemorrhagic telangiectasia, and the formation of spontaneous and induced microvascular thromboses and occlusions.
Figures
Similar articles
-
Spectral imaging facilitates visualization and measurements of unstable and abnormal microvascular oxygen transport in tumors.J Biomed Opt. 2008 Jan-Feb;13(1):014026. doi: 10.1117/1.2837439. J Biomed Opt. 2008. PMID: 18315384
-
In vivo microscopy of microvessel oxygenation and network connections.Microvasc Res. 2015 Mar;98:29-39. doi: 10.1016/j.mvr.2014.11.007. Epub 2014 Dec 10. Microvasc Res. 2015. PMID: 25500481
-
Combination of spectral and fluorescence imaging microscopy for wide-field in vivo analysis of microvessel blood supply and oxygenation.Opt Lett. 2013 Feb 1;38(3):332-4. doi: 10.1364/OL.38.000332. Opt Lett. 2013. PMID: 23381428
-
Wide-field functional imaging of blood flow and hemoglobin oxygen saturation in the rodent dorsal window chamber.Microvasc Res. 2011 Nov;82(3):199-209. doi: 10.1016/j.mvr.2011.07.004. Epub 2011 Jul 23. Microvasc Res. 2011. PMID: 21787792 Free PMC article. Review.
-
Novel imaging provides new insights into mechanisms of oxygen transport in tumors.Curr Mol Med. 2009 May;9(4):435-41. doi: 10.2174/156652409788167122. Curr Mol Med. 2009. PMID: 19519401 Free PMC article. Review.
Cited by
-
Acute variations in retinal vascular oxygen content in a rabbit model of retinal venous occlusion.PLoS One. 2012;7(11):e50179. doi: 10.1371/journal.pone.0050179. Epub 2012 Nov 20. PLoS One. 2012. PMID: 23185567 Free PMC article.
-
Hyperspectral wide-field-of-view imaging to study dynamic microcirculatory changes during hypoxia.Am J Physiol Heart Circ Physiol. 2022 Jul 1;323(1):H49-H58. doi: 10.1152/ajpheart.00624.2021. Epub 2022 May 6. Am J Physiol Heart Circ Physiol. 2022. PMID: 35522555 Free PMC article.
-
Limitations of the dorsal skinfold window chamber model in evaluating anti-angiogenic therapy during early phase of angiogenesis.Vasc Cell. 2014 Aug 4;6:17. doi: 10.1186/2045-824X-6-17. eCollection 2014. Vasc Cell. 2014. PMID: 25101168 Free PMC article.
-
Targeting Artificial Tumor Stromal Targets for Molecular Imaging of Tumor Vascular Hypoxia.PLoS One. 2015 Aug 26;10(8):e0135607. doi: 10.1371/journal.pone.0135607. eCollection 2015. PLoS One. 2015. PMID: 26308944 Free PMC article.
-
Neuronal and astroglial correlates underlying spatiotemporal intrinsic optical signal in the rat hippocampal slice.PLoS One. 2013;8(3):e57694. doi: 10.1371/journal.pone.0057694. Epub 2013 Mar 1. PLoS One. 2013. PMID: 23469218 Free PMC article.
References
-
- Dewhirst M. W., “Angiogenesis and blood flow in solid tumors,” in Drug Resistance in Oncology, Teicher B. A., Ed., pp. 3–23, Marcel Dekker, New York: (1993).
-
- Warren B. A., “The vascular morphology of tumors,” in Tumor Blood Circulation: Angiogenesis, Vascular Morphology and Blood Flow of Experimental and Human Tumors, Peterson H.-I., Ed., pp. 1–47, CRC Press, Inc., Boca Raton, FL: (1979).
Publication types
MeSH terms
Substances
Grants and funding
LinkOut - more resources
Full Text Sources
Other Literature Sources
Medical
