

Longitudinal optical imaging of tumor metabolism and hemodynamics
- PMID: 20210438
- PMCID: PMC2816992
- DOI: 10.1117/1.3285584
Longitudinal optical imaging of tumor metabolism and hemodynamics
Abstract
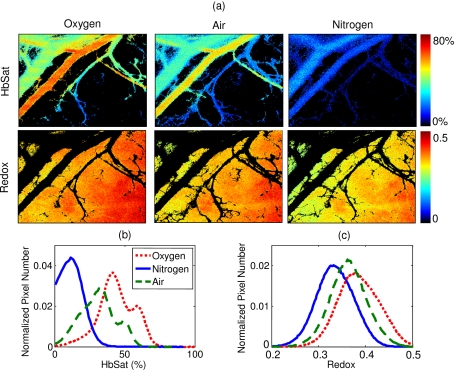
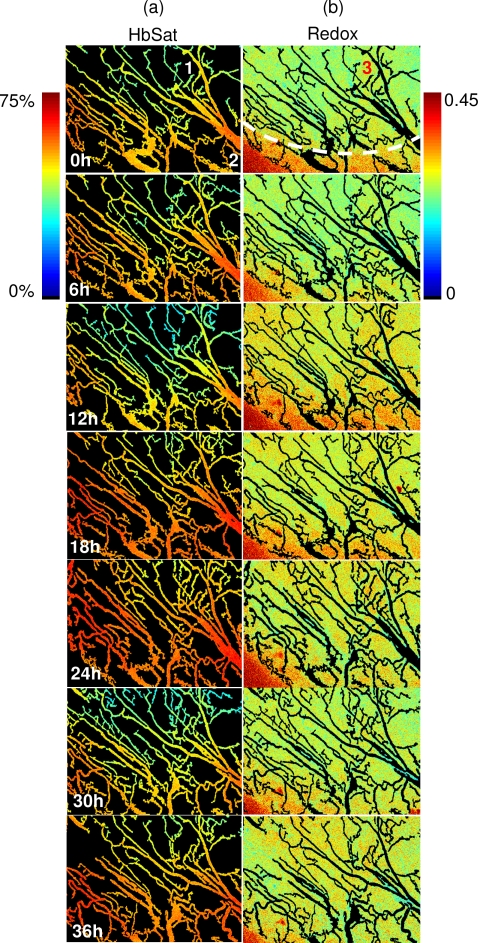
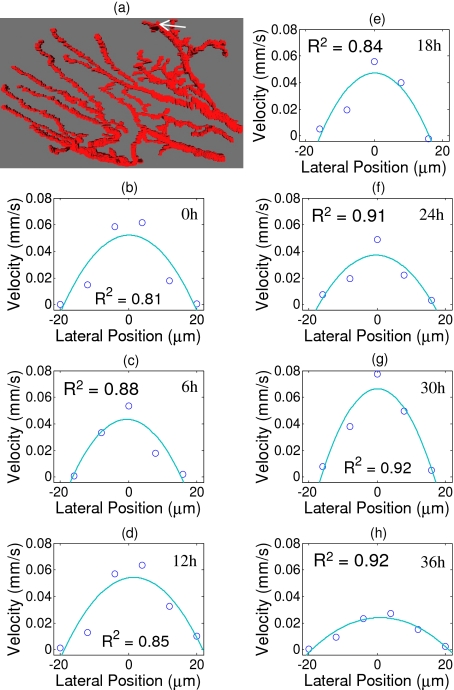
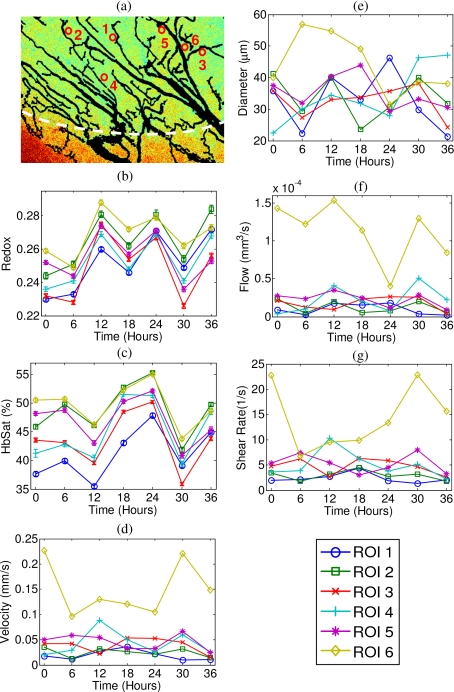
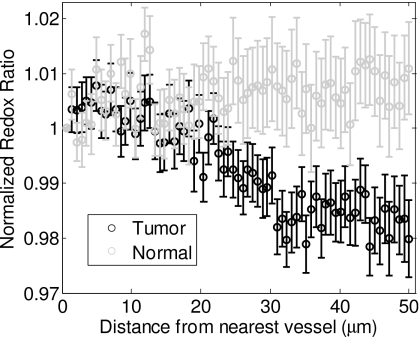
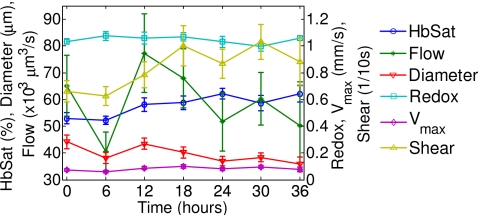
An important feature of tumor hypoxia is its temporal instability, or "cycling hypoxia." The primary consequence of cycling hypoxia is increased tumor aggressiveness and treatment resistance beyond that of chronic hypoxia. Longitudinal imaging of tumor metabolic demand, hemoglobin oxygen saturation, and blood flow would provide valuable insight into the mechanisms and distribution of cycling hypoxia in tumors. Fluorescence imaging of metabolic demand via the optical redox ratio (fluorescence intensity of FAD/NADH), absorption microscopy of hemoglobin oxygen saturation, and Doppler optical coherence tomography of vessel morphology and blood flow are combined to noninvasively monitor changes in oxygen supply and demand in the mouse dorsal skin fold window chamber tumor model (human squamous cell carcinoma) every 6 h for 36 h. Biomarkers for metabolic demand, blood oxygenation, and blood flow are all found to significantly change with time (p<0.05). These variations in oxygen supply and demand are superimposed on a significant (p<0.05) decline in metabolic demand with distance from the nearest vessel in tumors (this gradient was not observed in normal tissues). Significant (p<0.05), but weak (r<or=0.5) correlations are found between the hemoglobin oxygen saturation, blood flow, and redox ratio. These results indicate that cycling hypoxia depends on both oxygen supply and demand, and that noninvasive optical imaging could be a valuable tool to study therapeutic strategies to mitigate cycling hypoxia, thus increasing the effectiveness of radiation and chemotherapy.
Figures
Similar articles
-
Hyperspectral imaging of hemoglobin saturation in tumor microvasculature and tumor hypoxia development.J Biomed Opt. 2005 Jul-Aug;10(4):44004. doi: 10.1117/1.2003369. J Biomed Opt. 2005. PMID: 16178638
-
Combination of spectral and fluorescence imaging microscopy for wide-field in vivo analysis of microvessel blood supply and oxygenation.Opt Lett. 2013 Feb 1;38(3):332-4. doi: 10.1364/OL.38.000332. Opt Lett. 2013. PMID: 23381428
-
Computational Model for Tumor Oxygenation Applied to Clinical Data on Breast Tumor Hemoglobin Concentrations Suggests Vascular Dilatation and Compression.PLoS One. 2016 Aug 22;11(8):e0161267. doi: 10.1371/journal.pone.0161267. eCollection 2016. PLoS One. 2016. PMID: 27547939 Free PMC article.
-
Impact of hemoglobin levels on tumor oxygenation: the higher, the better?Strahlenther Onkol. 2006 Feb;182(2):63-71. doi: 10.1007/s00066-006-1543-7. Strahlenther Onkol. 2006. PMID: 16447012 Review.
-
Novel imaging provides new insights into mechanisms of oxygen transport in tumors.Curr Mol Med. 2009 May;9(4):435-41. doi: 10.2174/156652409788167122. Curr Mol Med. 2009. PMID: 19519401 Free PMC article. Review.
Cited by
-
Application of optical imaging and spectroscopy to radiation biology.Radiat Res. 2012 Apr;177(4):365-75. doi: 10.1667/rr2531.1. Epub 2012 Feb 23. Radiat Res. 2012. PMID: 22360397 Free PMC article. Review.
-
Bevacizumab-induced alterations in vascular permeability and drug delivery: a novel approach to augment regional chemotherapy for in-transit melanoma.Clin Cancer Res. 2012 Jun 15;18(12):3328-39. doi: 10.1158/1078-0432.CCR-11-3000. Epub 2012 Apr 10. Clin Cancer Res. 2012. PMID: 22496203 Free PMC article.
-
Label-Free Visualization of Early Cancer Hepatic Micrometastasis and Intraoperative Image-Guided Surgery by Photoacoustic Imaging.J Nucl Med. 2020 Jul;61(7):1079-1085. doi: 10.2967/jnumed.119.233155. Epub 2019 Dec 5. J Nucl Med. 2020. PMID: 31806769 Free PMC article.
-
Optical metabolic imaging identifies glycolytic levels, subtypes, and early-treatment response in breast cancer.Cancer Res. 2013 Oct 15;73(20):6164-74. doi: 10.1158/0008-5472.CAN-13-0527. Cancer Res. 2013. PMID: 24130112 Free PMC article.
-
Trans-illuminated laser speckle imaging of collateral artery blood flow in ischemic mouse hindlimb.J Biomed Opt. 2013 Sep;18(9):096011. doi: 10.1117/1.JBO.18.9.096011. J Biomed Opt. 2013. PMID: 24045691 Free PMC article.
References
Publication types
MeSH terms
Substances
Grants and funding
LinkOut - more resources
Full Text Sources
Other Literature Sources
