. 2010 Jan-Feb;15(1):016001.
doi: 10.1117/1.3306696.

Ex vivo imaging of human thyroid pathology using integrated optical coherence tomography and optical coherence microscopy

Affiliations

Ex vivo imaging of human thyroid pathology using integrated optical coherence tomography and optical coherence microscopy

Chao Zhou et al. J Biomed Opt. 2010 Jan-Feb.

Abstract

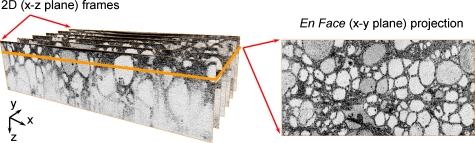
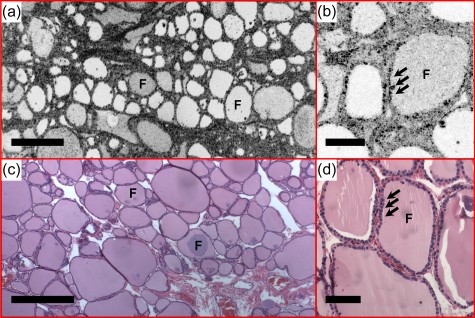
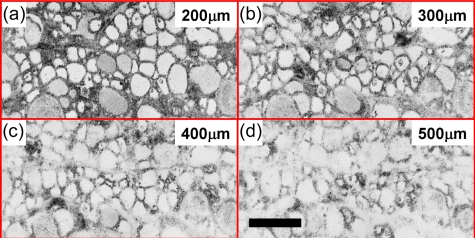
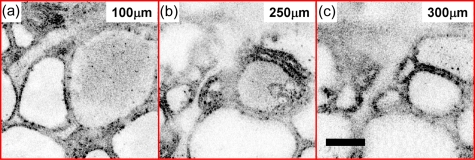
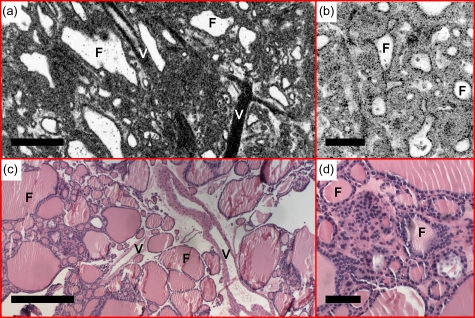
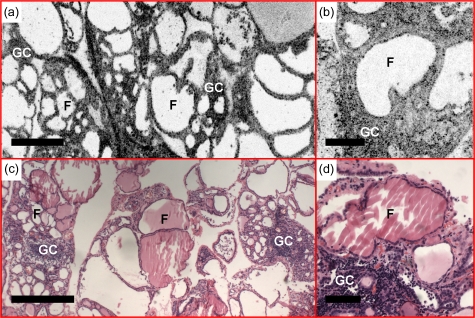
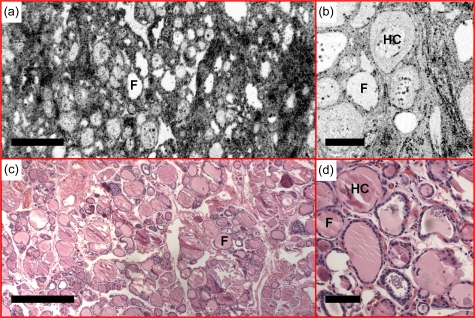
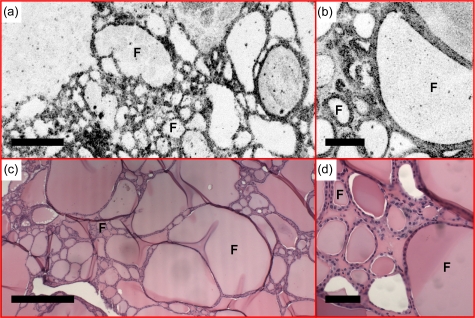
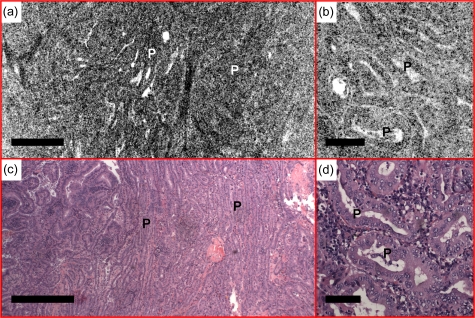
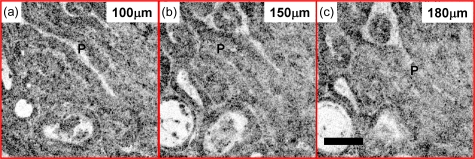
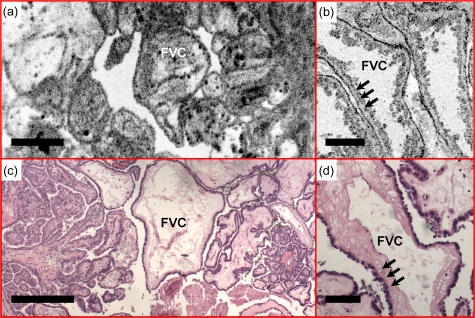
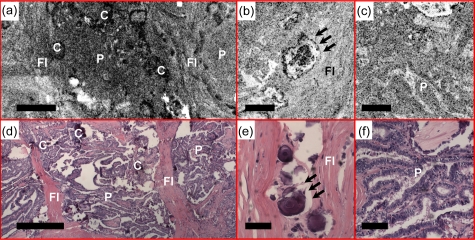
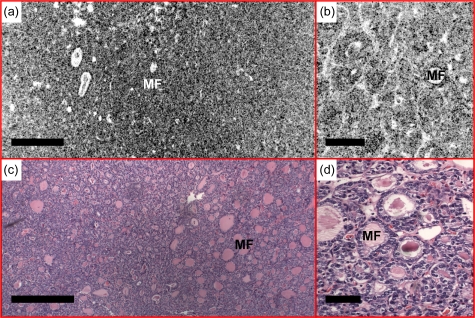
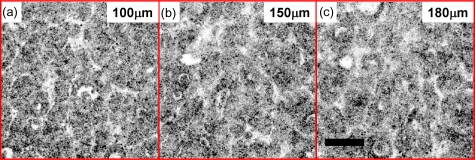
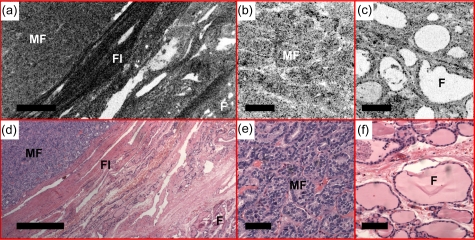
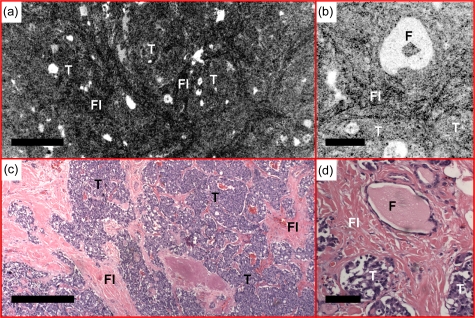
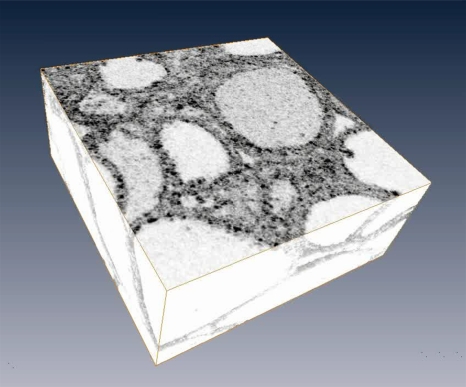
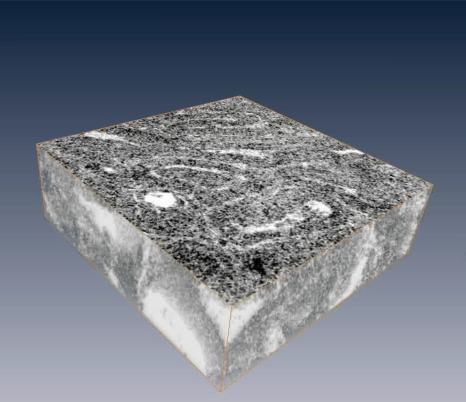
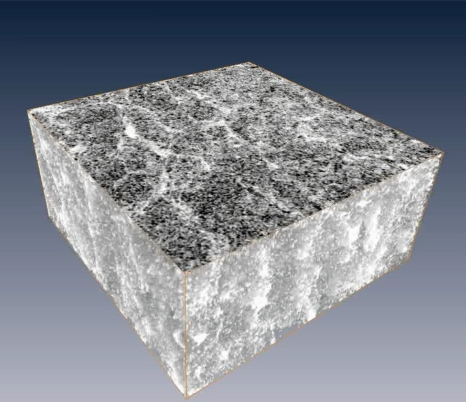
We evaluate the feasibility of optical coherence tomography (OCT) and optical coherence microscopy (OCM) for imaging of benign and malignant thyroid lesions ex vivo using intrinsic optical contrast. 34 thyroid gland specimens are imaged from 17 patients, covering a spectrum of pathology ranging from normal thyroid to benign disease/neoplasms (multinodular colloid goiter, Hashimoto's thyroiditis, and follicular adenoma) and malignant thyroid tumors (papillary carcinoma and medullary carcinoma). Imaging is performed using an integrated OCT and OCM system, with <4 microm axial resolution (OCT and OCM), and 14 microm (OCT) and <2 microm (OCM) transverse resolution. The system allows seamless switching between low and high magnifications in a way similar to traditional microscopy. Good correspondence is observed between optical images and histological sections. Characteristic features that suggest malignant lesions, such as complex papillary architecture, microfollicules, psammomatous calcifications, or replacement of normal follicular architecture with sheets/nests of tumor cells, can be identified from OCT and OCM images and are clearly differentiable from normal or benign thyroid tissues. With further development of needle-based imaging probes, OCT and OCM could be promising techniques to use for the screening of thyroid nodules and to improve the diagnostic specificity of fine needle aspiration evaluation.


Figures

Figure 1
Figure 1
En face OCT image (right) was constructed from the 3-D volumetric dataset (left), consisting of 640 2-D cross-sectional OCT images.
Figure 2
Figure 2
Normal thyroid demonstrates well-organized round to oval thyroid follicles (F). Colloid with various densities was observed under (a) en face OCT and (b) OCM, obtained about 100 and 50 μm below the tissue surface respectively, as different signal strength. The follicles are lined by a single layer of epithelium (arrows), which are clearly seen in the OCM image (b). (c) and (d) are corresponding HE slides (4 and 20×, respectively). Scale bars, 500 μm in (a) and (c), and 100 μm in (b) and (d).
Figure 3
Figure 3
En face OCT images of normal thyroid from various depths. Scale bar, 500 μm.
Figure 4
Figure 4
En face OCM images of normal thyroid from various depths. Scale bar, 100 μm. A 3-D OCM reconstruction of the normal follicles can be found in Video 1.
Figure 5
Figure 5
(a) En face OCT and (b) OCM, obtained about 60 and 50 μm below the tissue surface, respectively, demonstrate thyroid follicles (F) with variable sizes and shapes consistent with multinodular colloid goiter. Increased cellularity, reduced amount of colloid, and large blood vessels (V) were observed. (c) and (d) are corresponding HE slides (4 and 20×, respectively). Scale bars, 500 μm in (a) and (c), and 100 μm in (b) and (d).
Figure 6
Figure 6
Example of Hashimoto’s thyroiditis. (a) En face OCT and (b) OCM, obtained about 230 and 50 μm below the tissue surface, respectively, demonstrate enlarged and distorted follicles (F), increased interfollicular cellular density, interstitial lymphocytic infiltration, and germinal center (GC) formation. (c) and (d) are corresponding HE slides (4 and 20×, respectively). Scale bars, 500 μm in (a) and (c), and 100 μm in (b) and (d).
Figure 7
Figure 7
Fibrous variant of Hashimoto’s thyroiditis was observed with (a) en face OCT and (b) OCM, obtained about 160 and 50 μm below the tissue surface, respectively. Existence of hard colloid (HC) was observed under (b) OCM, featuring concentrated circles. (c) and (d) are corresponding HE slides (4 and 20×, respectively). Scale bars, 500 μm in (a) and (c), and 100 μm in (b) and (d).
Figure 8
Figure 8
(a) En face OCT and (b) OCM of follicular adenoma, obtained about 500 and 50 μm below the tissue surface, respectively, show follicles (F) with significantly varying sizes. (c) and (d) are corresponding HE slides (4 and 20×, respectively). Scale bars, 500 μm in (a) and (c), and 100 μm in (b) and (d).
Figure 9
Figure 9
Normal follicles are absent from the (a) en face OCT and (b) OCM images, obtained about 110 and 50 μm below the tissue surface, respectively, in a case of classic-type papillary carcinoma. The thyroid is replaced by complex papillae (P), showing irregular papillary fronds and complex branching features. (c) and (d) are corresponding HE slides (4 and 20×, respectively). Scale bars, 500 μm in (a) and (c), and 100 μm in (b) and (d).
Figure 10
Figure 10
En face OCM images of papillary carcinoma from various depths. The papillae structure can be visible from 180 μm below the tissue surface. Scale bar, 100 μm. A 3-D OCM reconstruction of the papillae is provided can be found in Video 2.
Figure 11
Figure 11
Fibrovascular cores (FVCs) of the papillae, another representative feature of classic-type papillary carcinoma, are clearly identified in the (a) en face OCT and (b) OCM images obtained about 100 and 50 μm below the tissue surface, respectively. A single layer of epithelium lines the follicles (arrows), with underlying dense fibrosis. (c) and (d) are corresponding HE slides (4 and 20×, respectively). Scale bars, 500 μm in (a) and (c), and 100 μm in (b) and (d).
Figure 12
Figure 12
Another case of classic-type papillary carcinoma, demonstrating features such as calcifications (C), clusters of papillae (P), and dense fibrosis (FI) in the (a) en face OCT and (b) and (c) OCM images obtained about 50 μm below the tissue surface. Psammoma bodies (arrows) can be clearly identified by (b) OCM. (d), (e), and (f) are corresponding HE slides (4 and 20×, respectively). Scale bars, 500 μm in (a) and (d), and 100 μm in (b), (c), (e), and (f).
Figure 13
Figure 13
A representative case of the follicular variant of papillary carcinoma. (a) En face OCT showed a homogeneous microfollicular (MF) pattern, where the details can be seen under (b) OCM. The en face OCT and OCM images were obtained about 200 and 50 μm below the tissue surface, respectively. The size of the microfollicles is approximately 50 μm, consistent with the HE histology in (c) and (d), 4 and 20×, respectively. Scale bars, 500 μm in (a) and (c), and 100 μm in (b) and (d).
Figure 14
Figure 14
En face OCM images of follicular variant of papillary carcinoma from various depths. The papillae structure can be visible from 180 μm below the tissue surface. Scale bar, 100 μm. A 3-D OCM reconstruction of the microfollicles can be found in Video 3.
Figure 15
Figure 15
(a) En face OCT shows the tumor interface with normal thyroid tissue in a case of papillary carcinoma, follicular variant. The tumor on the left side is clearly distinguished as densely packed microfollicles (MF), separated from the adjacent normal thyroid follicles (F) at the lower right corner by a dense fibrous (FI) capsule. Details of microfollicles and normal follicles are shown in (b) and (c) the OCM images. The en face OCT and OCM images were obtained about 60 and 50 μm below the tissue surface, respectively. (d), (e), and (f) are corresponding HE slides (4 and 20×, respectively). Scale bars, 500 μm in (a) and (d) and 100 μm in (b), (c), (e), and (f).
Figure 16
Figure 16
Sheets and nests of tumor cells (T) are surrounded by fibrous bands (FI) in medullary carcinoma observed with (a) en face OCT and (b) OCM obtained about 50 μm below the tissue surface. (c) and (d) are corresponding HE slides (4 and 20×, respectively). Scale bars, 500 μm in (a) and (c), and 100 μm in (b) and (d).
Video 1
Video 1
Three-dimensional OCM reconstruction of normal human thyroid showing round and oval follicles. Volume size is 400×400×300 μm (QuickTime, 1.5 MB)..
Video 2
Video 2
Three-dimensional OCM reconstruction of human thyroid with papillary carcinoma. Normal follicles of the thyroid are replaced by complex papillae, showing irregular papillary fronds and complex branching features. Volume size is 400×400×130 μm (QuickTime, 1.4 MB). .
Video 3
Video 3
Three-dimensional OCM reconstruction of human thyroid with follicular variant of papillary carcinoma. Normal follicles are absent from the specimen. Tightly packed microfollicles are the characteristic feature of the disease. Volume size is 400×400×180 μm (QuickTime, 1.4 MB). .

Similar articles

Cited by

References

    1. Hundahl S. A., Fleming I. D., Fremgen A. M., and Menck H. R., “A national cancer data base report on 53,856 cases of thyroid carcinoma treated in the US, 1985–1995,” Cancer (N.Y.) CANCAR 83, 2638–2648 (1998).10.1002/(SICI)1097-0142(19981215)83:12<2638::AID-CNCR31>3.0.CO;2-1 - DOI - PubMed
    1. Cancer Facts and Figures, American Cancer Society, Atlanta, GA: (2009).
    1. Wiest P. W., Hartshorne M. F., Inskip P. D., Crooks L. A., Vela B. S., Telepak R. J., Williamson M. R., Blumhardt R., Bauman J. M., and Tekkel M., “Thyroid palpation versus high-resolution thyroid ultrasonography in the detection of nodules,” J. Ultrasound Med. JUMEDA 17, 487–496 (1998). - PubMed
    1. Carroll B. A., “Asymptomatic thyroid-nodules—incidental sonographic detection,” Am. J. Roentgenol. AJROAM 138, 499–501 (1982). - PubMed
    1. Brander A., Viikinkoski P., Nickels J., and Kivisaari L., “Thyroid-gland—ultrasound screening in a random adult-population,” Radiology RADLAX 181, 683–687 (1991). - PubMed

Publication types

MeSH terms