

doi: 10.1117/1.3306704.
Fluorescence imaging of vascular endothelial growth factor in tumors for mice embedded in a turbid medium
Affiliations
- PMID: 20210458
- PMCID: PMC2839800
- DOI: 10.1117/1.3306704
Item in Clipboard
Fluorescence imaging of vascular endothelial growth factor in tumors for mice embedded in a turbid medium
J Biomed Opt.
2010 Jan-Feb.
Abstract
We demonstrate the feasibility of fluorescence imaging of deeply seated tumors using mice injected with an angiogenesis tracer, a vascular endothelial growth factor conjugated with the infrared dye cyanine 7 (VEGF/Cy7). Our optical-only imaging reconstruction method separately estimates the target depth, and then applies this information to reconstruct functional information such as fluorophore concentration. Fluorescence targets with concentrations as low as sub-25 nM are well reconstructed at depths up to 2 cm in both homogeneous and heterogeneous media with this technique.
Figures
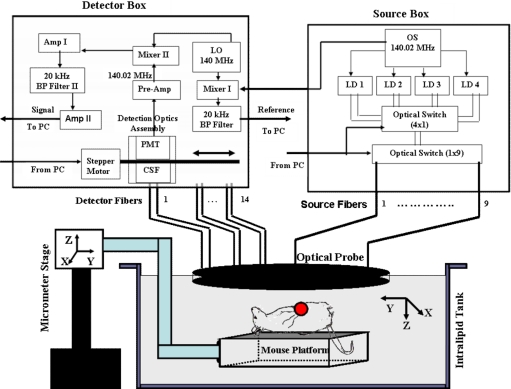
Diagram of the frequency-domain system with optical probe and arrangements for imaging experiments. Legend: OS is oscillator; LD is laser diode; LO is local oscillator; BP is bandpass; Pre-amp is preamplifier; Amp is amplifier; CSF is collimation system and filter; PMT is photomultiplier tube; and PC is personal computer. Measurement and reference signals are collected by the computer, and the optical switches are controlled by the same computer. Four laser diodes were in the system, but only one was used for the reported experiments.
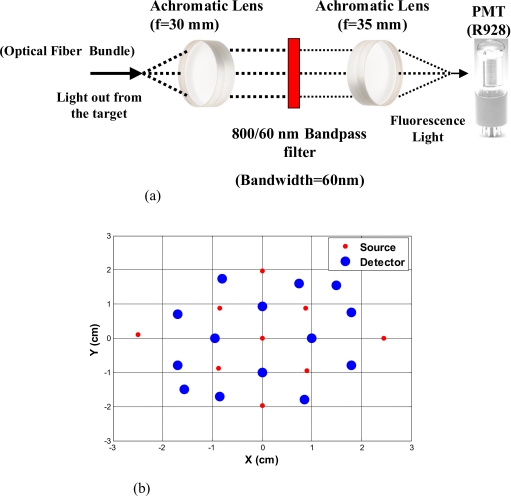
(a) The diagram of detection optics (CSF in Fig. 1). (b) Diagram of the optical probe.
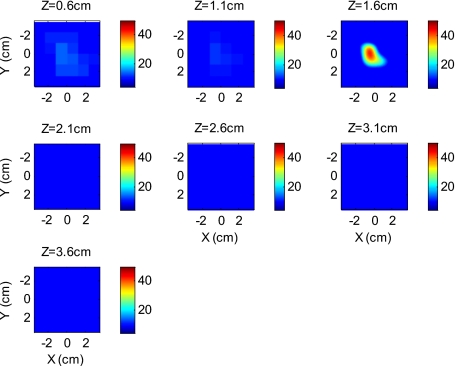
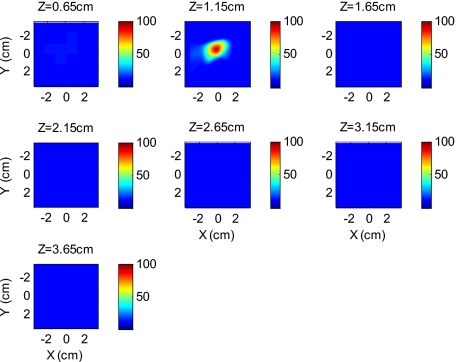
Reconstructed fluorescence image of a 50-nM Cy7 target in 2.0-nM background at 1.6-cm reconstructed depth. The first slice is reconstructed at 0.6 cm depth and the last one is at 3.6 cm. The increment in each slice is 0.5 cm in depth.
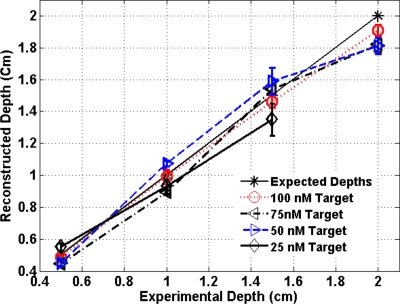
The reconstructed depth using the optical estimation algorithm plotted against the experimentally measured depth for different concentrations of targets at several depths.
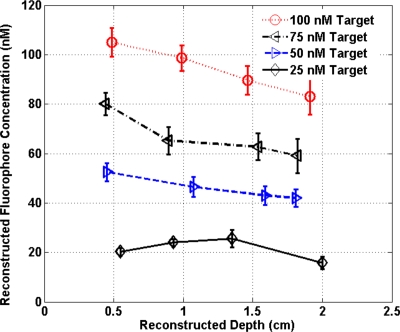
The concentrations of fluorophores reconstructed at reconstructed depths for the cases shown in Fig. 4.
Reconstructed fluorescence image of a 100-nM Cy7 target embedded in chicken breast. The first slice is reconstructed at 0.65 cm depth and the last one is at 3.65 cm. The increment in each slice is 0.5 cm in depth.
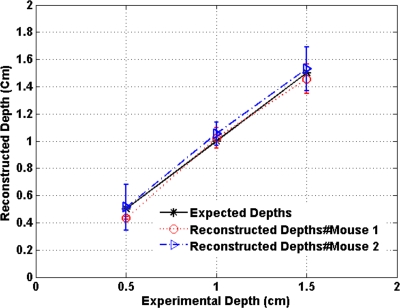
Plot of the reconstructed depths for the tumors in two mice versus experimentally measured depths.
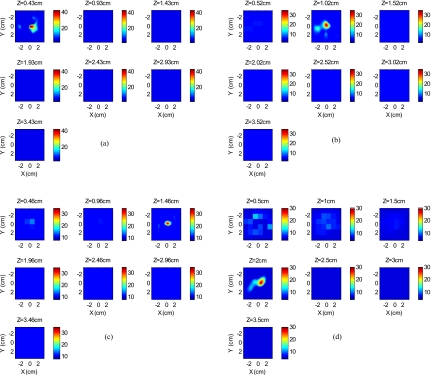
Reconstructed fluorescence images of tumor marked with VEGF∕Cy7 conjugate in mouse 1 at different reconstructed depths: (a) 0.43 cm, (b) 1.02 cm, (c) 1.46 cm, and (d) 2.0 cm. The rest of the slices in each figure correspond to coarse mesh in the background region. The depth is shown in the title of each subimage.
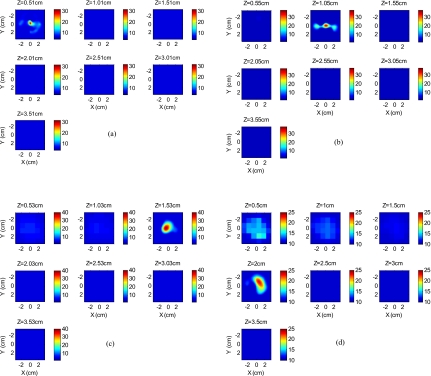
Reconstructed fluorescence images of tumor marked with VEGF∕Cy7 conjugate for mouse 2 at different reconstructed depths: (a) 0.51 cm, (b) 1.05 cm, (c) 1.53 cm, and (d) 2.0 cm. The rest of the slices in each figure correspond to coarse mesh in the background region. The depth is shown in the title of each subimage.
Similar articles
-
Transmission and fluorescence angular domain optical projection tomography of turbid media.Appl Opt. 2009 Nov 20;48(33):6448-57. doi: 10.1364/AO.48.006448. Appl Opt. 2009. PMID: 19935964
-
Macroscopic-imaging technique for subsurface quantification of near-infrared markers during surgery.J Biomed Opt. 2015 Mar;20(3):036014. doi: 10.1117/1.JBO.20.3.036014. J Biomed Opt. 2015. PMID: 25793562 Free PMC article.
-
Tracers for Fluorescence-Guided Surgery: How Elongation of the Polymethine Chain in Cyanine Dyes Alters the Pharmacokinetics of a Dual-Modality c[RGDyK] Tracer.J Nucl Med. 2018 Jun;59(6):986-992. doi: 10.2967/jnumed.117.205575. Epub 2018 Feb 15. J Nucl Med. 2018. PMID: 29449447
-
Semiautomatic landmark-based two-dimensional-three-dimensional image fusion in living mice: correlation of near-infrared fluorescence imaging of Cy5.5-labeled antibodies with flat-panel volume computed tomography.Mol Imaging. 2009 Jan-Feb;8(1):2-14. Mol Imaging. 2009. PMID: 19344571
-
Reconstruction of fluorophore concentration variation in dynamic fluorescence molecular tomography.IEEE Trans Biomed Eng. 2015 Jan;62(1):138-44. doi: 10.1109/TBME.2014.2342293. Epub 2014 Jul 24. IEEE Trans Biomed Eng. 2015. PMID: 25073161
Cited by
-
Imaging methods to evaluate tumor microenvironment factors affecting nanoparticle drug delivery and antitumor response.Cancer Drug Resist. 2021;4(2):382-413. doi: 10.20517/cdr.2020.94. Epub 2021 Jun 19. Cancer Drug Resist. 2021. PMID: 34796317 Free PMC article.
-
Fluorescent molecular imaging: technical progress and current preclinical and clinical applications in urogynecologic diseases.Curr Mol Med. 2013 Dec;13(10):1568-78. doi: 10.2174/1566524013666131111125758. Curr Mol Med. 2013. PMID: 24206135 Free PMC article. Review.
-
Imaging a photodynamic therapy photosensitizer in vivo with a time-gated fluorescence tomography system.J Biomed Opt. 2012 Jul;17(7):071306. doi: 10.1117/1.JBO.17.7.071306. J Biomed Opt. 2012. PMID: 22894467 Free PMC article.
-
Decoding Tumor Angiogenesis for Therapeutic Advancements: Mechanistic Insights.Biomedicines. 2024 Apr 9;12(4):827. doi: 10.3390/biomedicines12040827. Biomedicines. 2024. PMID: 38672182 Free PMC article. Review.
-
Optical imaging in vivo with a focus on paediatric disease: technical progress, current preclinical and clinical applications and future perspectives.Pediatr Radiol. 2011 Feb;41(2):161-75. doi: 10.1007/s00247-010-1907-0. Epub 2011 Jan 11. Pediatr Radiol. 2011. PMID: 21221568 Free PMC article. Review.
References
-
- Cubeddu R., Comelli D., Andrea C. D., Taroni P., and Valentini G., “Time-resolved fluorescence imaging in biology and medicine,” J. Phys. D JPAPBE 35, R61–R76 (2002).10.1088/0022-3727/35/9/201 - DOI
