

Cellular resolution ex vivo imaging of gastrointestinal tissues with optical coherence microscopy
- PMID: 20210470
- PMCID: PMC2847935
- DOI: 10.1117/1.3322704
Cellular resolution ex vivo imaging of gastrointestinal tissues with optical coherence microscopy
Abstract
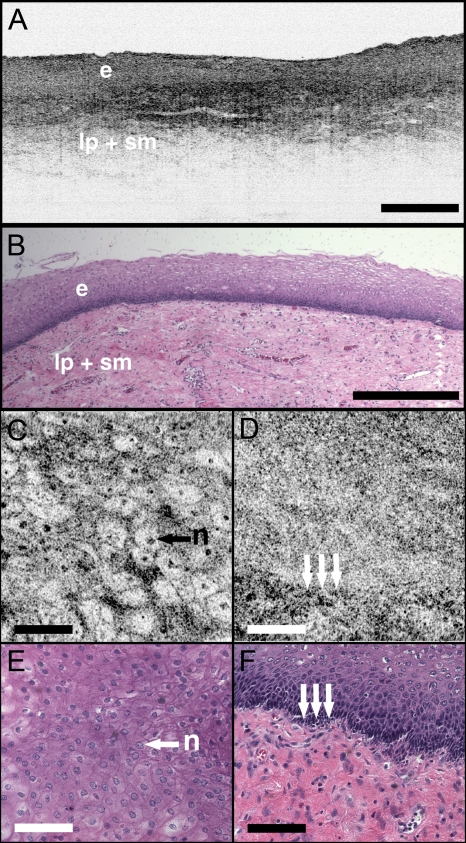
Optical coherence microscopy (OCM) combines confocal microscopy and optical coherence tomography (OCT) to improve imaging depth and contrast, enabling cellular imaging in human tissues. We aim to investigate OCM for ex vivo imaging of upper and lower gastrointestinal tract tissues, to establish correlations between OCM imaging and histology, and to provide a baseline for future endoscopic studies. Co-registered OCM and OCT imaging were performed on fresh surgical specimens and endoscopic biopsy specimens, and images were correlated with histology. Imaging was performed at 1.06-microm wavelength with <2-microm transverse and <4-microm axial resolution for OCM, and at 14-microm transverse and <3-microm axial resolution for OCT. Multiple sites on 75 tissue samples from 39 patients were imaged. OCM enabled cellular imaging of specimens from the upper and lower gastrointestinal tracts over a smaller field of view compared to OCT. Squamous cells and their nuclei, goblet cells in Barrett's esophagus, gastric pits and colonic crypts, and fine structures in adenocarcinomas were visualized. OCT provided complementary information through assessment of tissue architectural features over a larger field of view. OCM may provide a complementary imaging modality to standard OCT approaches for endoscopic microscopy.
Figures


Similar articles
-
Integrated optical coherence tomography and microscopy for ex vivo multiscale evaluation of human breast tissues.Cancer Res. 2010 Dec 15;70(24):10071-9. doi: 10.1158/0008-5472.CAN-10-2968. Epub 2010 Nov 5. Cancer Res. 2010. PMID: 21056988 Free PMC article.
-
Ultrahigh resolution optical coherence tomography of Barrett's esophagus: preliminary descriptive clinical study correlating images with histology.Endoscopy. 2007 Jul;39(7):599-605. doi: 10.1055/s-2007-966648. Endoscopy. 2007. PMID: 17611914
-
Integrated local binary pattern texture features for classification of breast tissue imaged by optical coherence microscopy.Med Image Anal. 2017 May;38:104-116. doi: 10.1016/j.media.2017.03.002. Epub 2017 Mar 8. Med Image Anal. 2017. PMID: 28327449 Free PMC article.
-
Optical coherence tomography.ScientificWorldJournal. 2007 Jan 26;7:87-108. doi: 10.1100/tsw.2007.29. ScientificWorldJournal. 2007. PMID: 17334603 Free PMC article. Review.
-
Optical coherence tomography and Doppler optical coherence tomography in the gastrointestinal tract.World J Gastroenterol. 2011 Jan 7;17(1):15-20. doi: 10.3748/wjg.v17.i1.15. World J Gastroenterol. 2011. PMID: 21218079 Free PMC article. Review.
Cited by
-
Automated imaging cytometry reveals dysplastic indices of colonic serrated adenomas.Future Sci OA. 2020 Feb 21;6(4):FSO459. doi: 10.2144/fsoa-2019-0111. Future Sci OA. 2020. PMID: 32257372 Free PMC article.
-
Integrated optical coherence tomography and optical coherence microscopy imaging of ex vivo human renal tissues.J Urol. 2012 Feb;187(2):691-9. doi: 10.1016/j.juro.2011.09.149. Epub 2011 Dec 16. J Urol. 2012. PMID: 22177199 Free PMC article.
-
Volumetric optical frequency domain imaging of pulmonary pathology with precise correlation to histopathology.Chest. 2013 Jan;143(1):64-74. doi: 10.1378/chest.11-2797. Chest. 2013. PMID: 22459781 Free PMC article.
-
Ultrahigh speed spectral-domain optical coherence microscopy.Biomed Opt Express. 2013 Jul 1;4(8):1236-54. doi: 10.1364/BOE.4.001236. eCollection 2013. Biomed Opt Express. 2013. PMID: 24009989 Free PMC article.
-
Advanced endoscopic imaging for detecting and guiding therapy of early neoplasias of the esophagus.Ann N Y Acad Sci. 2020 Dec;1482(1):61-76. doi: 10.1111/nyas.14523. Epub 2020 Nov 12. Ann N Y Acad Sci. 2020. PMID: 33184872 Free PMC article. Review.
References
-
- Chen Y., Aguirre A. D., Hsiung P. L., Desai S., Herz P. R., Pedrosa M., Huang Q., Figueiredo M., Huang S. W., Koski A., Schmitt J. M., Fujimoto J. G., and Mashimo H., “Ultrahigh resolution optical coherence tomography of Barrett’s esophagus: preliminary descriptive clinical study correlating images with histology,” Endoscopy ZZZZZZ 39, 599–605 (2007).10.1055/s-2007-966648 - DOI - PubMed
-
- M. V.Sivak, Jr., Kobayashi K., Izatt J. A., Rollins A. M., Ung-Runyawee R., Chak A., Wong R. C., Isenberg G. A., and Willis J., “High-resolution endoscopic imaging of the GI tract using optical coherence tomography,” Gastrointest. Endosc. ZZZZZZ 51, 474–479 (2000).10.1016/S0016-5107(00)70450-0 - DOI - PubMed
Publication types
MeSH terms
Grants and funding
LinkOut - more resources
Full Text Sources
Other Literature Sources
