

doi: 10.1117/1.3302806.
Doppler variance imaging for three-dimensional retina and choroid angiography
Affiliations
- PMID: 20210473
- PMCID: PMC2839803
- DOI: 10.1117/1.3302806
Item in Clipboard
Doppler variance imaging for three-dimensional retina and choroid angiography
J Biomed Opt.
2010 Jan-Feb.
Abstract
We demonstrate the use of Doppler variance (standard deviation) imaging for 3-D in vivo angiography in the human eye. In addition to the regular optical Doppler tomography velocity and structural images, we use the variance of blood flow velocity to map the retina and choroid vessels. Variance imaging is subject to bulk motion artifacts as in phase-resolved Doppler imaging, and a histogram-based method is proposed for bulk-motion correction in variance imaging. Experiments were performed to demonstrate the effectiveness of the proposed method for 3-D vasculature imaging of human retina and choroid.
Figures
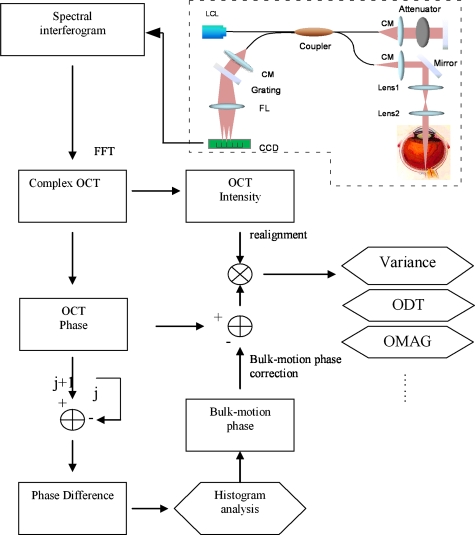
Flow diagram of the variance∕Doppler imaging process (CM, collimator; FL, focusing lens; LCL, low-coherence light source).
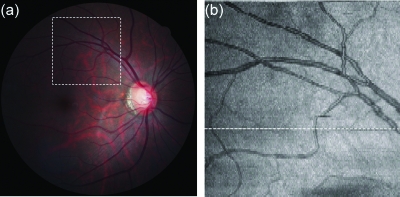
(a) Fundus image showing the 3-D variance∕Doppler scan over an area of 2.5 mm by 2.5 mm (within a dashed window); (b) OCT fundus image.
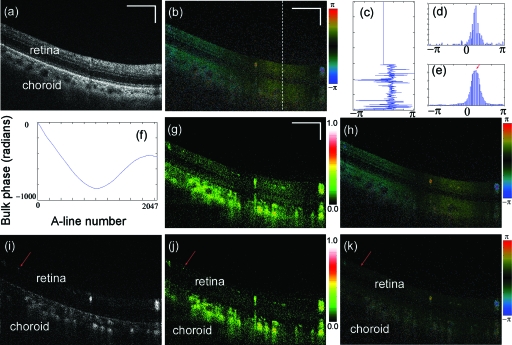
(a) B-scan OCT image as highlighted in Fig. 2; (b) phase difference between adjacent A-lines without average; (c) plot of the highlighted phase difference in 3(b); (d) histogram and (e) smoothed histogram of Fig. 3c; (f) accumulated bulk-motion phase of each A-line. Figures 3g, 3h show the variance and ODT images without bulk-motion correction, respectively. Figure 3i shows the corresponding OMAG image. Figures 3j, 3k show the variance and ODT images after bulk-motion correction, respectively. The scale bars represent 500 μm.

Three-dimensional angiography of the human eye by different imaging modalities: (a) top view (projection) of 3-D variance imaging; (b) color-coded variance image. Figure 4c shows the 3-D ODT image, and Figs. 4d, 4e show the top view and color-coded results from 3-D OMAG.
References
Publication types
MeSH terms
Grants and funding
LinkOut - more resources
Full Text Sources
Other Literature Sources
