

Sex-specific population structure, natural selection, and linkage disequilibrium in a wild bird population as revealed by genome-wide microsatellite analyses
- PMID: 20211004
- PMCID: PMC2846931
- DOI: 10.1186/1471-2148-10-66
Sex-specific population structure, natural selection, and linkage disequilibrium in a wild bird population as revealed by genome-wide microsatellite analyses
Abstract
Background: Sexual dimorphism in ecologically important traits is widespread, yet the differences in the genomic architecture between the two sexes are largely unexplored. We employed a genome-wide multilocus approach to examine the sexual differences in population subdivision, natural selection and linkage disequilibrium (LD) in a wild Siberian jay (Perisoreus infaustus) population, using genotypes at a total of 107 autosomal and Z-chromosomal microsatellites.
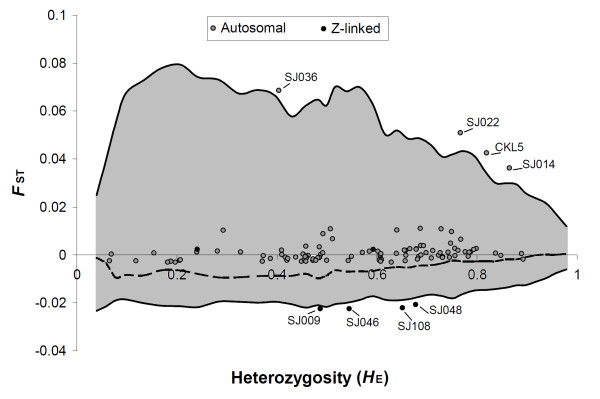
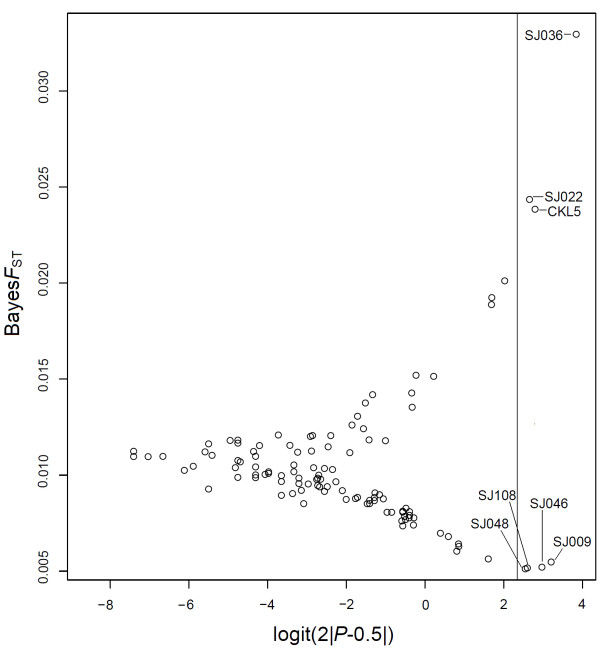
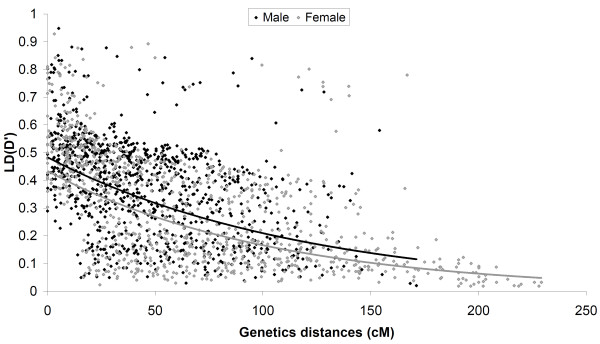
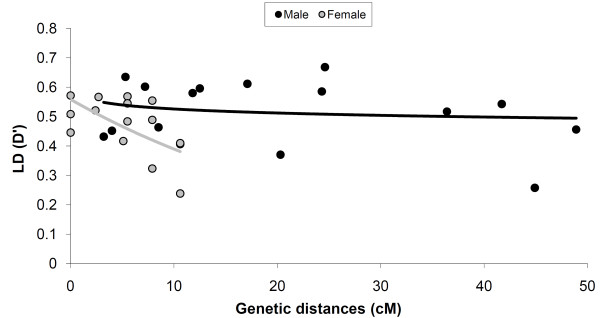
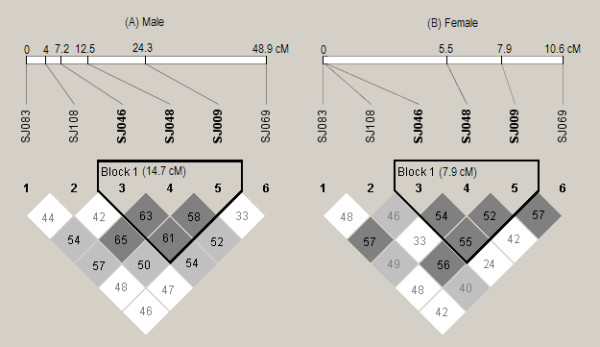
Results: Mean observed heterozygosity was significantly higher in females (HO = 0.567) than in males (HO = 0.532), and autosomal markers (HO = 0.561) were more variable than Z-chromosomal markers (HO = 0.512). Genetic differentiation (FST = 0.002, P < 0.05) between the two sexes was low but significant and males were on average significantly more genetically related to each other than females. Genomescan analyses revealed that 3 out of 101 (3%) autosomal loci were under directional selection, while 4 out of 6 (67%) Z-chromosomal markers were indicated to be under balancing selection. This suggests a significantly greater but contrasting selection force on the Z-chromosome in comparison to autosomes, which is consistent with an overall significantly (P < 0.05) lower FSTvalue for Z-chromosomal (-0.014, 95% CI: -0.025 - -0.011) than for the autosomal loci (0.003, 95% CI: 0.001 - 0.004). Analysis of syntenic marker pairs revealed high levels of LD in both sexes but significantly (P < 0.05) lower levels of LD in the females both on autosomes and Z-chromosome, probably due to the higher rate of dispersal and the higher recombination rates on autosomes, as well as the pseudoautosomal markers. In both sexes LD decayed rapidly with genetic distance in a similar fashion on autosomes, while a more rapid decay of LD in Z-chromosome was detected in females than in males.
Conclusion: We conclude that there are many clear differences in genomic architecture between the sexes studied here which can be at least partly understood in the light of higher dispersal rate of females as compared to males and the unusual structure of the Z-chromosome of the species.
Figures
References
Publication types
MeSH terms
LinkOut - more resources
Full Text Sources
Research Materials
Miscellaneous
