. 2010 Mar 5;140(5):652-65.
doi: 10.1016/j.cell.2010.01.007.

miR-328 functions as an RNA decoy to modulate hnRNP E2 regulation of mRNA translation in leukemic blasts

Affiliations

miR-328 functions as an RNA decoy to modulate hnRNP E2 regulation of mRNA translation in leukemic blasts

Anna M Eiring et al. Cell. .

Abstract

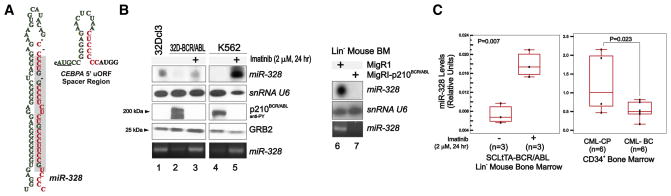
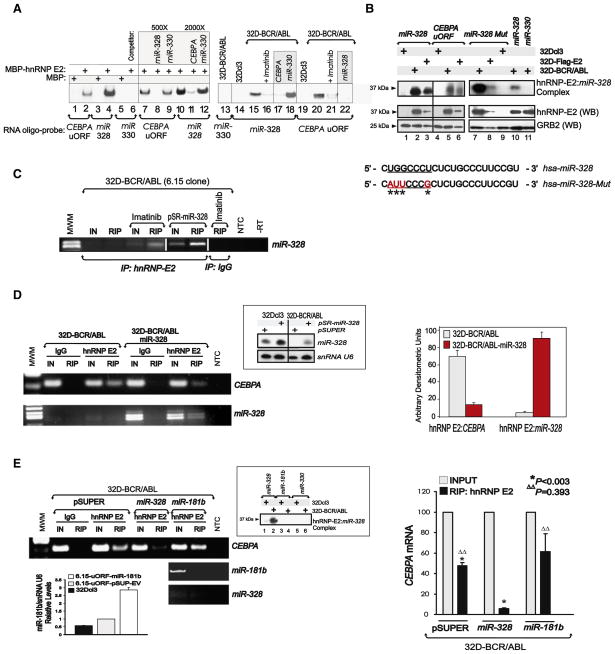
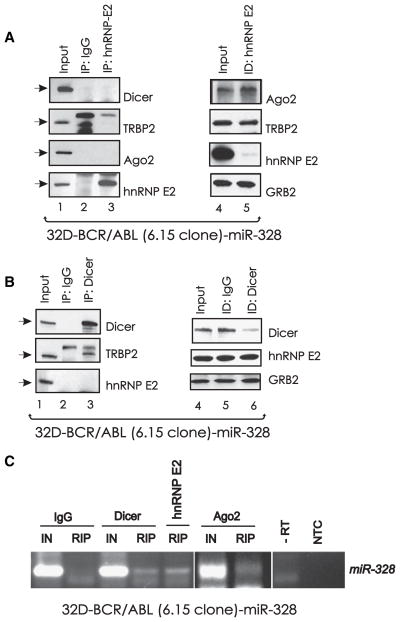
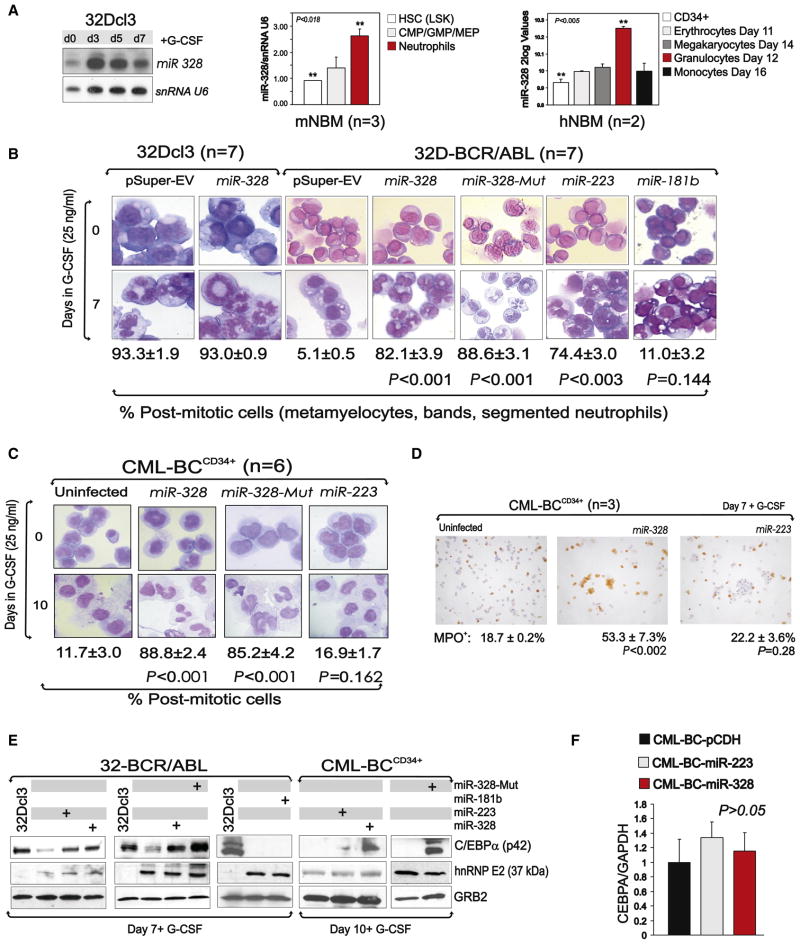
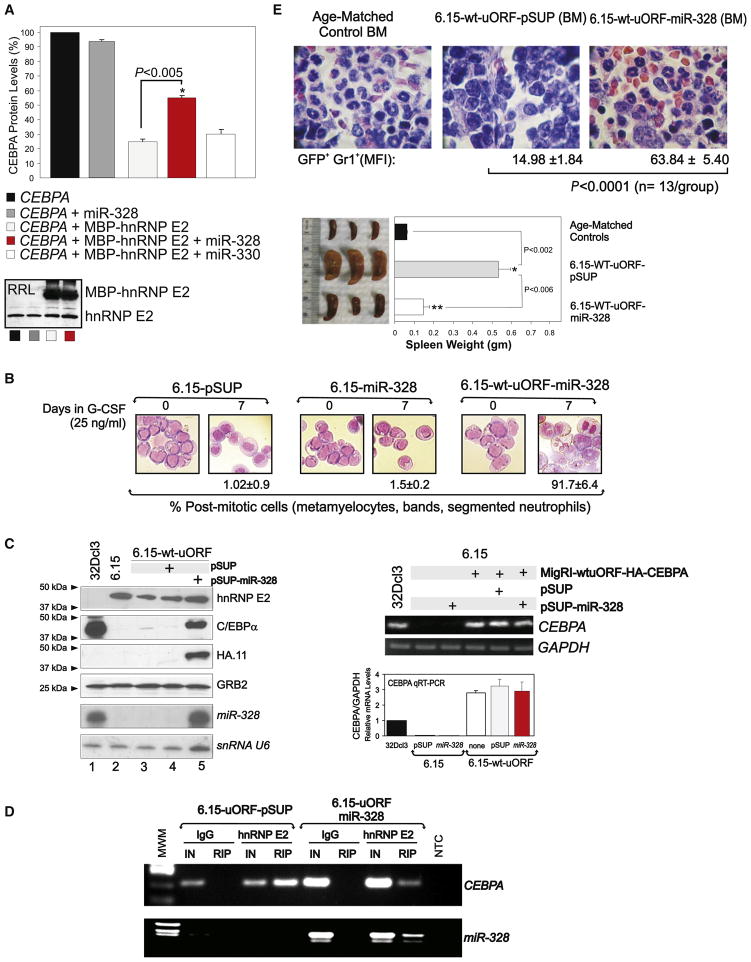
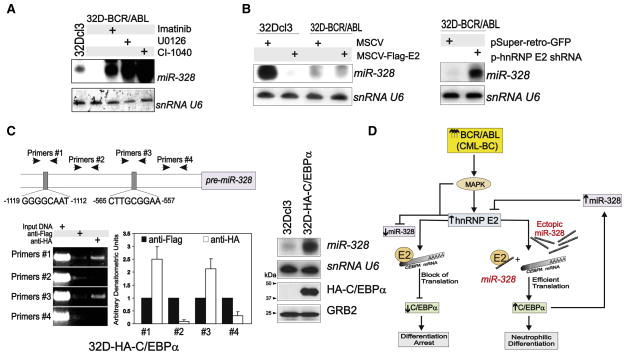
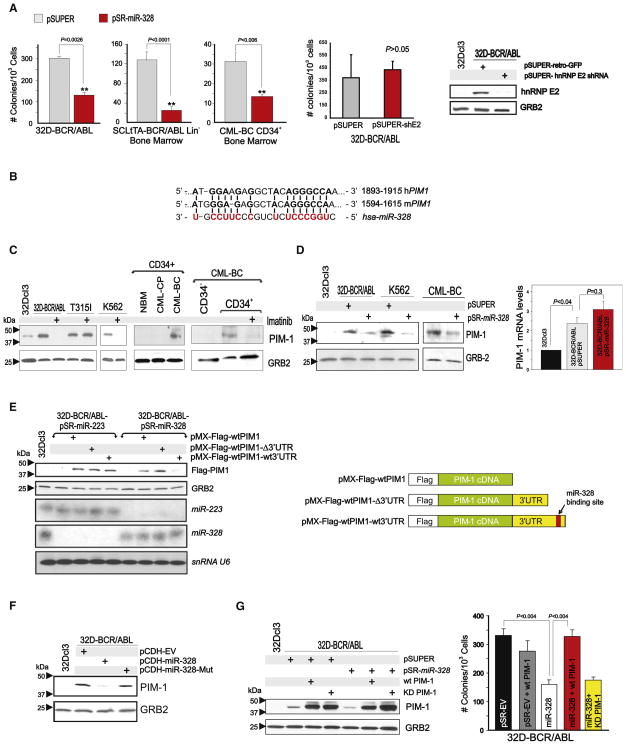
MicroRNAs and heterogeneous ribonucleoproteins (hnRNPs) are posttranscriptional gene regulators that bind mRNA in a sequence-specific manner. Here, we report that loss of miR-328 occurs in blast crisis chronic myelogenous leukemia (CML-BC) in a BCR/ABL dose- and kinase-dependent manner through the MAPK-hnRNP E2 pathway. Restoration of miR-328 expression rescues differentiation and impairs survival of leukemic blasts by simultaneously interacting with the translational regulator poly(rC)-binding protein hnRNP E2 and with the mRNA encoding the survival factor PIM1, respectively. The interaction with hnRNP E2 is independent of the microRNA's seed sequence and it leads to release of CEBPA mRNA from hnRNP E2-mediated translational inhibition. Altogether, these data reveal the dual ability of a microRNA to control cell fate both through base pairing with mRNA targets and through a decoy activity that interferes with the function of regulatory proteins.


Figures

Figure 1
Figure 1. miR-328 Is Downregulated in CML-BC
(A) hnRNP E2 consensus binding sites (red) in the precursor and mature (gray box) miR-328 and in the CEBPA uORF/spacer region. (B) Left: Northern blot and RT-PCR show miR-328 levels and western blot shows BCR/ABL levels in 32Dcl3 and untreated or imatinib-treated 32D-BCR/ABL cells; right: northern blot and RT-PCR show miR-328 levels in vector- and BCR/ABL-infected lineage-negative (Lin) mouse BM cells. (C) qRT-PCR shows miR-328 levels in untreated (n = 3) and imatinib-treated (n = 3) Lin BM cells from leukemic SCLtTA-BCR/ABL mice (left) and in CD34+ BM progenitors from CML-CP (n = 6) and CML-BC (n = 6) patients (right). snRNA U6 and GRB2 levels were used as loading controls (mean ± standard error of the mean [SEM]).
Figure 2
Figure 2. miR-328 Competes with CEBPA mRNA for Binding to hnRNP E2
(A) REMSA shows binding of miR-328, CEBPA uORF, and miR-330 RNA probes to MBP-tagged hnRNP E2 (lanes 2, 4, 6, 7–12), MBP (lanes 1, 3, 5), and cytoplasmic lysates of 32Dcl3 (lanes 14, 19) and untreated or imatinib-treated 32D-BCR/ABL cells (lanes 13, 15–18, 20–22). Cold competitor RNAs were used as indicated (lanes 8–9, 11–12, 17–18, 22). (B) Top: UV crosslinking shows binding of miR-328 (lanes 1–3 and 10), CEBPA uORF (lanes 4–6), the seed sequence-mutated miR-328 (miR-328-Mut) (lanes 7–9), and miR-330 (lane 11) to hnRNP E2 in 32Dcl3, 32D-BCR/ABL, and 32D-Flag-E2 cell lysates (lanes 1–6). Bottom: Western Blots show levels of hnRNP E2 and GRB2 in the lysates used in UV crosslinking. Sequence of the wild-type and seed sequence-mutated miR-328 with substituted nucleotides indicated by asterisks. (C) RNA Immunoprecipitation (RIP) assay for miR-328 performed on anti-hnRNP E2 immunoprecipitates (IPs) from lysates of untreated (lane 3), imatinib-treated (lane 5), and pSR-miR-328-transduced (lane 7) 32D-BCR/ABL (6.15 clone) cells. RIP with a nonrelated IgG served as controls (lane 8). IN: input RNA; MWM: molecular weight marker (lane 1); NTC: nontemplate control;-RT: no reverse transcribed PCR reaction. RIP was also observed with ectopically expressed Flag-hnRNP E2 proteins (see Figure S1). (D) Left: RIP assays for CEBPA mRNA (top) and miR-328 (bottom) performed on anti-hnRNP E2 (lanes 5 and 9) and nonrelated IgG (lanes 3 and 7) IPs from parental (lanes 2–5) and miR-328-expressing (lanes 6–9) 32D-BCR/ABL cells. IN: RNA input; MWM: molecular weight marker (lane 1); NTC: nontemplate PCR control. hnRNP E2 RIP assays for a nonrelated mRNA (i.e., SET) are reported in Figure S1. Inset top right: Northern blot shows levels of ectopic miR-328 in vector- (lanes 1 and 3) and miR-328-transduced (lanes 2 and 4) 32Dcl3 and 32D-BCR/ABL cells. snRNA U6 was analyzed for normalization. Right: Densitometric analyses of the levels of CEBPA mRNA and miR-328 associated to hnRNP E2 evaluated by RIP assays (n = 4) performed with parental (light bars) and miR-328-expressing (dark bars) 32D-BCR/ABL cells (mean ± SEM). (E) Left: RIP assays for CEBPA mRNA (top) on anti-hnRNP E2 IPs from vector (pSuper)- (lane 5), miR-328- (lane 7), and miR-181b-transduced (lane 9) 32D-BCR/ABL cells; RIP assays for miR-181b (middle) and miR-328 (bottom) on anti-hnRNP E2 IPs from miR-181b-expressing 32D-BCR/ABL cells (lanes 8 and 9). Inset top right: UV crosslinking with miR-328, miR-181b, and miR-330 32P-labeled oligoribonucleotides and cytoplasmic lysates of 32Dcl3 (lanes 1, 3, and 5) and 32D-BCR/ABL (lanes 2, 4, and 6) cells. Binding of hnRNP E2 to miR-328 is shown in lane 2. Inset bottom left: Graph shows qRT-PCR analysis of miR-181b expression in 32Dcl3 (black), vector- (gray), and pSUP-miR-181b-transduced (white) 32D-BCR/ABL cells (mean ± SEM). Right: Densitometric analysis of the RIP’ed CEBPA mRNA associated to hnRNP E2 (n = 3), expressed as percentage of the input RNA (IN), in vector-, miR-328-, and miR-181b-transduced 32D-BCR/ABL cells (mean ± SEM). Controls for endogenous and ectopic hnRNP E2 protein and miR-328 expression levels and the specificity of the RIP protocol are shown in Figure S1.
Figure 3
Figure 3. hnRNP E2:miR-328 Interaction Does Not Associate with the RISC Loading Complex
Western blots show levels of Dicer, TRBP2, Ago2, and/or hnRNP E2 in cytoplasmic lysates (input; lanes 1 and 4), in anti-hnRNP E2 (A) and anti-Dicer (B) IPs (lane 3), in IPs with an isotype-matched IgG (lane 2), and in hnRNP E2-and Dicer-immunodepleted (ID) lysates (lane 5) of 32D-BCR/ABL-miR-328cells. (C) RIP assay for miR-328 on anti-Dicer (lane 4), anti-hnRNP E2 (lane 5), and anti-Ago2 (lane 7) IPs from 32D-BCR/ABL-miR-328 cell lysates. Note that the anti-hnRNP E2 RIP for miR-328 was performed on Dicer-immunodepleted lysates. RIP with a nonrelated IgG served as a negative control.
Figure 4
Figure 4. miR-328 Rescues Granulocytic Differentiation through Restoration of C/EBPα Expression
(A) miR-328 levels in (left) 32Dcl3 cells undergoing G-CSF-induced differentiation; (middle) Lin/Sca+/Kit+ HSC, CMP/GMP/MEP committed progenitors and mature neutrophil BM subpopulations from wild-type C57BL/6 mice (mean ± SEM); and (right) CD34+ human BM cells undifferentiated (white) and induced to differentiate for the indicated time toward the erythroid (light gray), megakaryocytic (dark gray), granulocytic (red), or monocytic (black) lineages (mean ± SEM). (B) Wright-Giemsa-stained cytospins of G-CSF-treated (0–7 days) pSuper-, miR-328-, miR-328-Mut-, miR-223-, and/or miR-181b-infected 32Dcl3 and/or 32D-BCR/ABL cells (mean ± SEM). Levels of miR-223 in BCR/ABL+ cell lines and primary cells and effect of ectopic miR-223 on cell proliferation are reported in Figure S2. (C) Wright-Giemsa-stained cytospins of primary G-CSF-treated (0–10 days) uninfected and miR-328-, miR-328-Mut-, and miR-223-infected CML-BCCD34+ BM progenitors (mean ± SEM). For levels of ectopic miR-328 and miR-223 expression in primary CML-BC cells, see Figure S2. (D) Myeloperoxidase (MPO) immunostaining of G-CSF-treated uninfected and miR-328- and miR-223-transduced CML-BCCD34+ BM cells. Data are representative of three independent experiments (mean ± SEM). (E) Western blot shows C/EBPα, hnRNP E2, and GRB2 levels in G-CSF-treated 32Dcl3 and empty vector-, miR-328-, miR-223-, miR-328-Mut-, and/or miR-181b-infected 32D-BCR/ABL and CML-BCCD34+ BM cells (right). (F) qRT-PCR shows levels of CEBPA in empty vector-, miR-223-, or miR-328-infected CML-BC cells (mean ± SEM). qRT-PCR showing CEBPA mRNA levels in empty vector-, miR-223-, or miR-328-transduced 32D-BCR/ABL cells (mean ± SEM) is reported in Figure S2.
Figure 5
Figure 5. In Vitro and In Vivo Interference of miR-328 with hnRNP E2 Translation Inhibition of C/EBPα Expression
(A) Levels of newly synthesized 35S-C/EBPα protein in RRL translation reactions programmed with CEBPA mRNA (derived from pcDNA3-WT-uORF-C/EBPα) (black), CEBPA mRNA and mature miR-328 RNA oligonucleotides (dark gray), CEBPA mRNA and recombinant MBP-hnRNP E2 protein either alone (light gray) or in the presence of mature miR-328 (red), or miR-330 (white; negative control) RNA oligonucleotides. Data are expressed as percentage of the mean ± SEM and are representative of three different experiments performed in duplicate. Inset: Western blot shows levels of both endogenous RRL hnRNP E2 and recombinant MBP-hnRNP E2. (B) Wright-Giemsa-stained cytospins of G-CSF-treated (0–7 days) 6.15-pSUP, 6.15-miR-328, and 6.15-WT-uORF-miR-328 cells (mean ± SEM). (C) Left: Levels of hnRNP E2, endogenous and HA-tagged C/EBPα, and GRB2 proteins and miR-328 and snRNA U6 in parental 32Dcl3, 6.15-pSUP-transduced, and miR-328-transduced 6.15-WT-uORF cells; right: RT-PCR and qRT-PCR show levels of CEBPA mRNA in 32Dcl3, 6.15, 6.15-miR-328, and 6.15-WT-uORF-HA-CEBPA cells either uninfected or infected with pSUP or miR-328 constructs. GAPDH levels were measured for normalization (mean ± SEM). (D) RIP assays for CEBPA mRNA (top) and miR-328 (bottom) on anti-hnRNP E2 (lanes 5 and 9) and nonrelated IgG (lanes 3 and 7) IPs from 6.15-uORF-pSUP (lanes 2–5) and 6.15-uORF-miR-328 cells (lanes 6–9). IN: input RNA. (E) Top: H&E-staining of BM shows maturation of BCR/ABL+ cells in mice injected with p-SUPERIOR vector- (middle) and miR-328-transduced (right) 6.15-WT-uORF cells. Age-matched mice (left) served as a control. FACS analysis shows mean fluorescence intensity (MFI; mean ± SEM) of differentiated GFP+Gr1+BCR/ABL+ cells at 3 weeks post-transplant from BM of 3 mice/group. Bottom: Visual analysis and weight of spleens from the same groups of mice (mean ± SEM).
Figure 6
Figure 6. Pathways Regulating miR-328 Expression
miR-328 levels in 32Dcl3 and/or 32D-BCR/ABL cells (A) treated with imatinib or the MAPK inhibitors U0126 and CI-1040 or (B) expressing a Flag-hnRNP E2 (left) or a shRNA-targeting hnRNP E2 (right). (C) Top: Representation of the C/EBPα-binding sites within the miR-328 promoter; bottom: Chromatin immunoprecipitation (ChIP) with anti-HA antibody shows binding of HA-C/EBPα to miR-328 promoter sequences in 32D-HA-C/EBPα cells (left: ChIP blot; middle: densitometric analysis). Anti-Flag immunoprecipitates served as negative controls. Bars indicate the mean ± SEM from three independent experiments; northern and western blots (right) show levels of miR-328 and HA-C/EBPα, respectively, in parental and 32D-HA-C/EBPα cells. U6 snRNA and GRB2 protein levels were used as controls. (D) Model of the molecular network regulating miR-328 expression in CML-BC and miR-328 decoy activity in BCR/ABL+ myeloid cell differentiation by direct interference with hnRNP E2 translation inhibition of C/EBPα expression.
Figure 7
Figure 7. miR-328 Impairs Survival through Targeting of PIM1 Kinase mRNA
(A) IL-3-independent or -dependent methylcellulose colony formation (mean ± SEM from triplicates of three independent experiments) of vector- (gray bars) and miR-328-transduced (red bars) 32D-BCR/ABL cells (IL-3-independent), leukemic Lin SCLtTA-BCR/ABL (n = 5) (IL-3-dependent) cells, CML-BCCD34+ (n = 2) (IL-3 dependent) BM progenitors, and vector- (pSUPER) or hnRNP E2 shRNA (pSUPER-shE2)-infected 32D-BCR/ABL cells (IL-3-independent). Inset: Western blot shows hnRNP E2 levels upon shRNA knockdown. (B) miR-328-binding site (red) within the 3′UTR of mouse and human PIM1 mRNA. (C) PIM1 protein levels in 32Dcl3, untreated or imatinib-treated 32D-BCR/ABL (wild-type and T315I) and K562 cells (left); in CD34+ BM cells from healthy donors (NBM), CML-CP, and CML-BC patients (middle); and in the CD34, untreated and imatinib-treated CD34+ BM fractions from a CML-BC patient. (D) Left: Effect of miR-328 expression on PIM1 protein levels in 32D-BCR/ABL, K562, and CML-BCCD34+ BM cells. 32Dcl3 cells were used as a negative control; right: PIM1 mRNA expression by qRT-PCR in 32Dcl3, vector-transduced, and miR-328-transduced 32D-BCR/ABL. Representative of triplicates from three independent experiments (mean ± SEM). (E) Left: Levels of ectopic Flag-PIM1 proteins from constructs lacking (pMX-Flag-WTPIM1) and harboring the wild-type (pMX-Flag-WTPIM1-WT3′UTR) or 196 base pair end-terminal-deleted (pMX-Flag-WTPIM1-Δ3′UTR) PIM1 3′UTR in miR-223- or miR-328-expressing 32D-BCR/ABL. Northern blot shows levels of miR-223, miR-328, and snRNA U6. Right: Schematic representation of the Flag-PIM1 constructs. (F) Effect of seed sequence-mutated (miR-328-Mut) on endogenous PIM1 expression in parental 32Dcl3 and empty vector (pCDH)-, miR-328-, and miR-328-Mut-infected 32D-BCR/ABL cells. (G) Left: Endogenous and ectopic (wild-type [WT PIM-1] and kinase-deficient [KD PIM-1]) PIM1 protein levels in 32Dcl3, pSUPER- and pSR-miR-328-infected 32D-BCR/ABL cells; right: graph shows rescue of IL-3-independent clonogenic activity of miR-328-expressing (white) 32D-BCR/ABL cells to normal levels (black) by ectopic wild-type (red) but not kinase-deficient (yellow) PIM1 construct lacking the 3′UTR. Effect of PIM1 forced expression on vector-transduced clonogenicity (gray). Bars represent the mean ± SEM of colony numbers from three independent experiments.

Comment in

Similar articles

Cited by

References

    1. Agirre X, Jimenez-Velasco A, San Jose-Eneriz E, Garate L, Bandres E, Cordeu L, Aparicio O, Saez B, Navarro G, Vilas-Zornoza A, et al. Down-regulation of hsa-miR-10a in chronic myeloid leukemia CD34+ cells increases USF2-mediated cell growth. Mol Cancer Res. 2008;6:1830–1840. - PubMed
    1. Bartel DP. MicroRNAs: Target recognition and regulatory functions. Cell. 2009;136:215–233. - PMC - PubMed
    1. Brown V, Jin P, Ceman S, Darnell JC, O’Donnell WT, Tenenbaum SA, Jin X, Feng Y, Wilkinson KD, Keene JD, et al. Microarray identification of FMRP-associated brain mRNAs and altered mRNA translational profiles in fragile X syndrome. Cell. 2001;107:477–487. - PubMed
    1. Bueno MJ, Perez de Castro I, Gomez de Cedron M, Santos J, Calin GA, Cigudosa JC, Croce CM, Fernandez-Piqueras J, Malumbres M. Genetic and epigenetic silencing of microRNA-203 enhances ABL1 and BCR-ABL1 oncogene expression. Cancer Cell. 2008;13:496–506. - PubMed
    1. Carpenter B, MacKay C, Alnabulsi A, MacKay M, Telfer C, Melvin WT, Murray GI. The roles of heterogeneous nuclear ribonucleoproteins in tumour development and progression. Biochim Biophys Acta. 2006;1765:85–100. - PubMed

Publication types

MeSH terms