. 2010 Mar 5;140(5):666-77.
doi: 10.1016/j.cell.2010.01.038.

Stc1: a critical link between RNAi and chromatin modification required for heterochromatin integrity

Affiliations

Stc1: a critical link between RNAi and chromatin modification required for heterochromatin integrity

Elizabeth H Bayne et al. Cell. .

Abstract

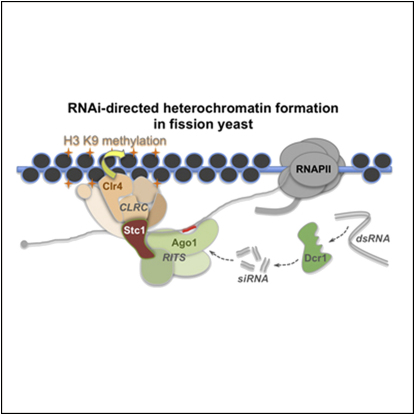
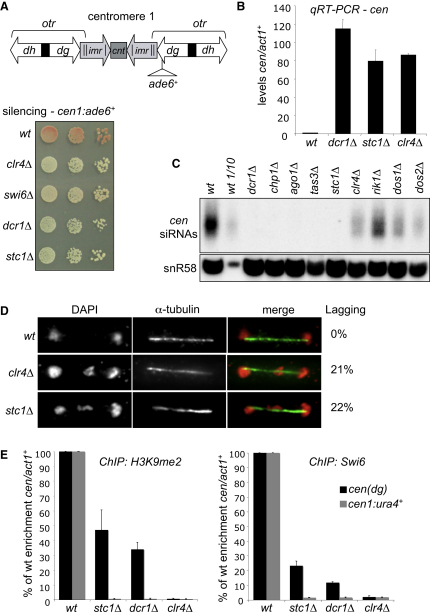
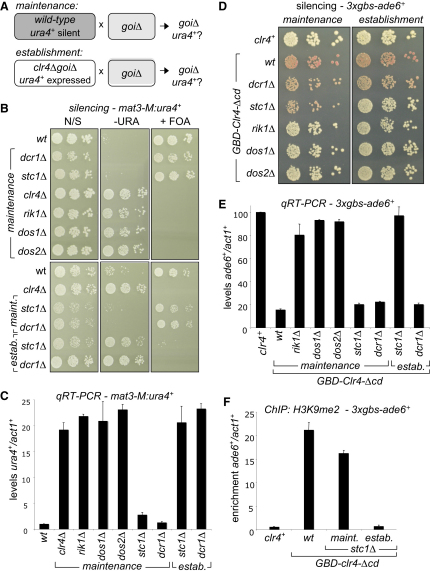
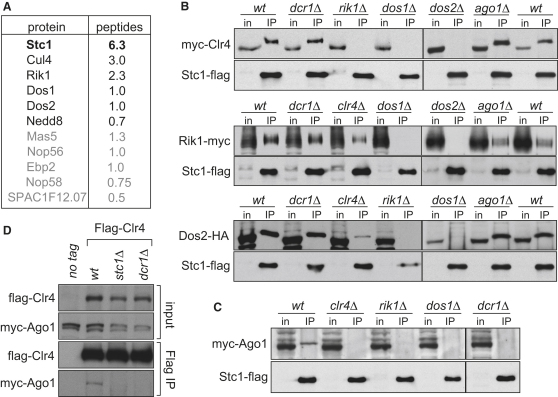
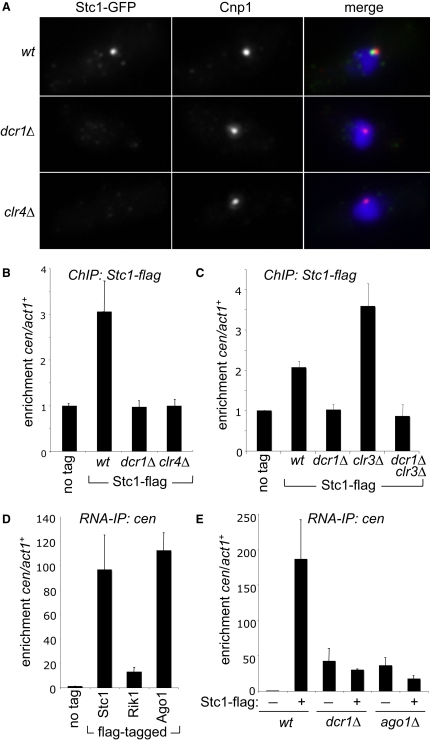
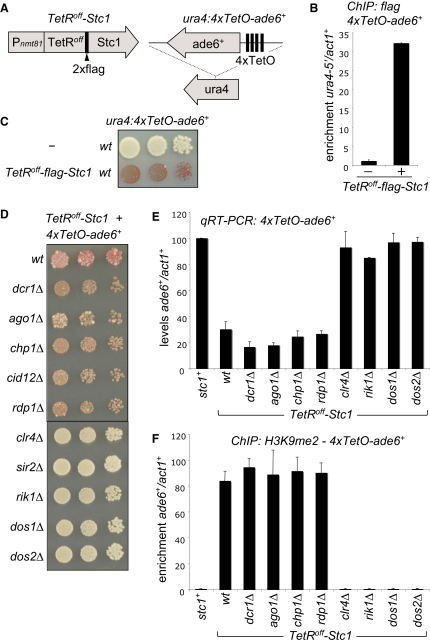
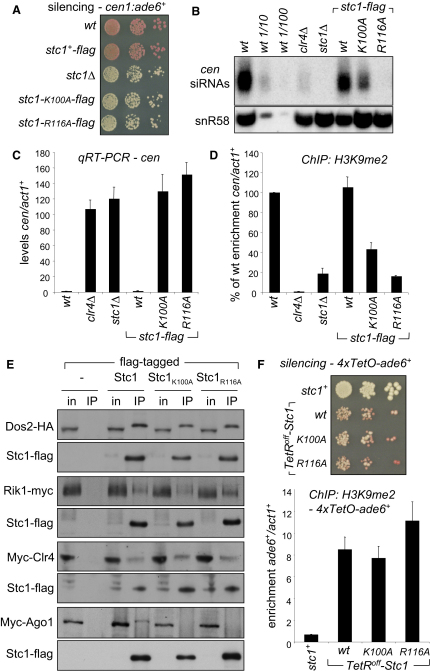
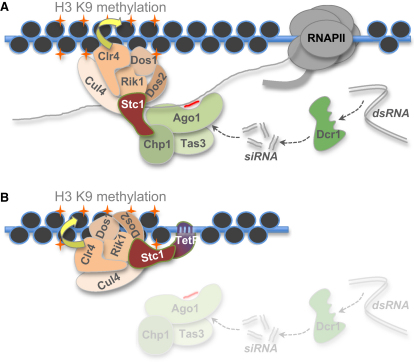
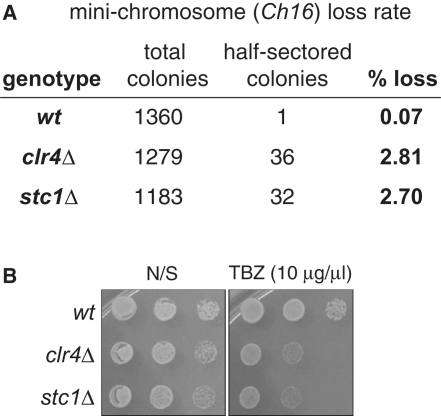
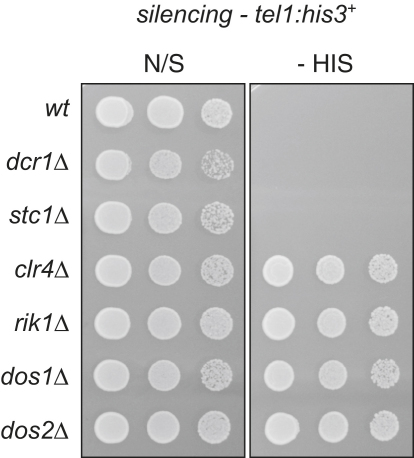
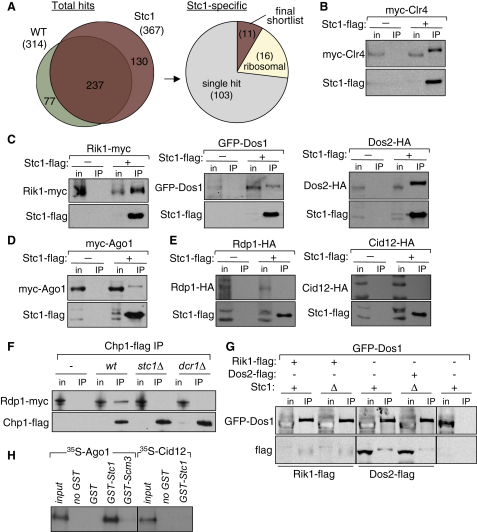
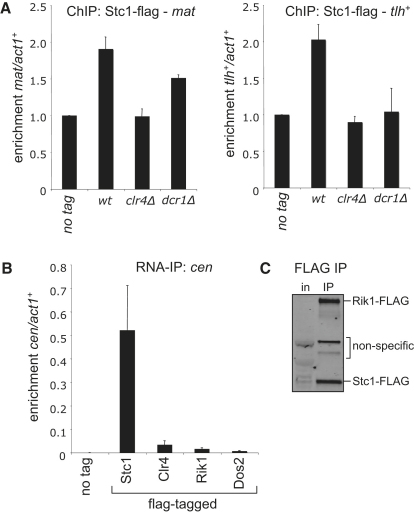
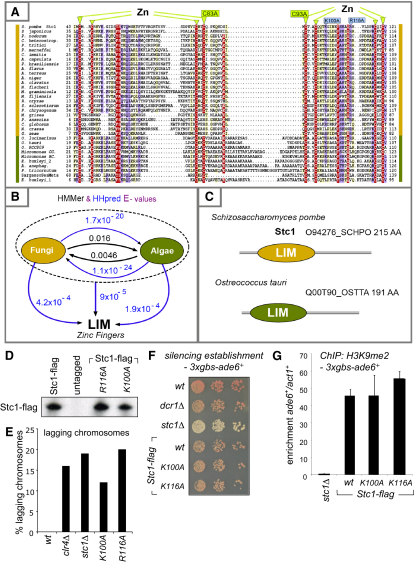
In fission yeast, RNAi directs heterochromatin formation at centromeres, telomeres, and the mating type locus. Noncoding RNAs transcribed from repeat elements generate siRNAs that are incorporated into the Argonaute-containing RITS complex and direct it to nascent homologous transcripts. This leads to recruitment of the CLRC complex, including the histone methyltransferase Clr4, promoting H3K9 methylation and heterochromatin formation. A key question is what mediates the recruitment of Clr4/CLRC to transcript-bound RITS. We have identified a LIM domain protein, Stc1, that is required for centromeric heterochromatin integrity. Our analyses show that Stc1 is specifically required to establish H3K9 methylation via RNAi, and interacts both with the RNAi effector Ago1, and with the chromatin-modifying CLRC complex. Moreover, tethering Stc1 to a euchromatic locus is sufficient to induce silencing and heterochromatin formation independently of RNAi. We conclude that Stc1 associates with RITS on centromeric transcripts and recruits CLRC, thereby coupling RNAi to chromatin modification.


Figures

None
Graphical abstract
Figure 1
Figure 1
Stc1 Is Required for RNAi-Directed Silencing at Centromeres (A) Assay for silencing at cen1:ade6+. Diagram shows position of the cen1:ade6+ marker gene in centromere 1, relative to outer repeat (otr) dg and dh elements, inner repeats (imr), and central core (cnt). Wild-type cells with silenced cen1:ade6+ form red colonies on limiting adenine; loss of silencing leads to pink/white colonies. (B) qRT-PCR analysis of cen(dg) transcript levels relative to a control transcript act1+, normalized to the wild-type. (C) Northern analysis of centromeric siRNAs, including a dilution series for wild-type. Loading control: snoRNA58 (snR58). (D) Analysis of lagging chromosomes in anaphase by fluorescence microscopy. Representative images show fixed cells stained for DNA (DAPI—red) and tubulin (green). Percentages of anaphase cells with lagging chromosomes are indicated (n = 100). (E) ChIP analysis of H3K9me2 and Swi6 levels associated with cen(dg) or cen1:ura4+, relative to act1+, and normalized to wild-type. See also Figure S1. All error bars indicate standard deviation (SD).
Figure 2
Figure 2
Stc1 Is Required for Establishment but Not Maintenance of Silencing at mat2-mat3 and a Clr4-Tethered Site (A) Diagram of crosses performed to assess establishment versus maintenance of silencing of a ura4+ marker gene inserted into the mating-type locus (mat3-M:ura4+; goi is gene of interest). (B) Assay for silencing at mat3-M:ura4+; plates are nonselective (N/S), lacking uracil (−URA) or supplemented with FOA (+FOA). Loss of silencing results in growth on –URA and loss of resistance to FOA. (C) qRT-PCR analysis of mat3-M:ura4+ transcript levels relative to act1+, normalized to the wild-type. (D) Assay for silencing of 3xgbs-ade6+, mediated by tethered Clr4 (GBD-Clr4-Δcd) (Kagansky et al., 2009). Recruitment of GBD-Clr4 induces silencing of 3xgbs-ade6+, resulting in red colonies on limiting adenine; loss of silencing leads to white colonies. Maintenance was assessed by crossing mutant cells with cells in which silencing was established; to assess establishment, GBD-Clr4-Δcd and 3xgbs-ade6+ constructs were combined in mutant backgrounds. (E) qRT-PCR analysis of 3xgbs-ade6+ transcript levels relative to act1+, normalized to those in cells lacking tethered Clr4 (clr4+). (F) ChIP analysis of H3K9me2 levels on 3xgbs-ade6+. See also Figure S2. All error bars indicate SD.
Figure 3
Figure 3
Stc1 Interacts with CLRC and Ago1 (A) List of proteins found specifically and reproducibly associated with Stc1-FLAG by affinity purification and mass spectrometry (LC-MS/MS). Average numbers of peptides identified in each replicate are shown. (B and C) Stc1-FLAG IP followed by western analysis determining requirements for Stc1 association with Rik1-myc, GFP-Dos1, Dos2-HA, myc-Clr4, and myc-Ago1. (D) Clr4 association with Ago1 requires Stc1. Flag-Clr4 IP followed by western analysis of myc-Ago1. See also Figure S3.
Figure 4
Figure 4
Stc1 Associates with Centromeres and Centromeric Transcripts (A) Analysis of Stc1-GFP localization in wild-type or mutant cells by immunofluorescence. Representative images show staining of fixed cells for Stc1-GFP (green), Cnp1 (red), and DNA (DAPI—blue). (B and C) ChIP analysis of Stc1-FLAG association with cen-dg relative to act1+. (D and E) RNA immunoprecipitation (RNA-IP) analysis of cen transcripts associated with FLAG-tagged Stc1, Rik1, or Ago1 under native conditions. Enrichments shown are normalized to levels of RNA immunoprecipitated from wild-type, untagged control cells; in dcr1Δ or ago1Δ cells, Stc1-FLAG IPs should be compared to IPs from untagged cells bearing the same mutation since loss of silencing in these mutants causes higher levels of cen transcript to accumulate resulting in higher background RNA levels. See also Figure S4. All error bars indicate SD.
Figure 5
Figure 5
Tethering Stc1 Induces Silencing Independent of RNAi (A) Diagram of constructs used: TetRoff-Stc1 (integrated at leu1+) and the 4xTetO-ade6+ reporter inserted at the ura4+ locus. (B) FLAG ChIP analysis of TetRoff-Stc1 fusion protein association with 4xTetO-ade6+ relative to act1+. (C and D) Assay for silencing of 4xTetO-ade6+. Cells are plated on limiting adenine; red colonies indicate ade6+ silencing, and white colonies indicate ade6+ expression. (E) qRT-PCR analysis of 3xgbs-ade6+ transcript levels relative to act1+, normalized to those in cells lacking tethered Stc1 (stc1+). (F) ChIP analysis of H3K9me2 levels on 4xTetO-ade6+. All error bars indicate SD.
Figure 6
Figure 6
Stc1 Association with Ago1 Is Disrupted by Mutations in the LIM Domain (A) Assay for silencing of cen1:ade6+. Wild-type, silencing cells form red colonies; loss of silencing leads to pink/white colonies. (B) Northern analysis of centromeric siRNAs, including a dilution series for wild-type. Loading control: snoRNA58 (snR58). (C) qRT-PCR analysis of cen(dg) transcript levels relative to a control transcript act1+. (D) ChIP analysis of H3K9me2 levels associated with cen(dg). (E) Western analysis of wild-type or mutant Stc1-FLAG IPs to detect Dos2-HA, myc-Clr4, Rik1-myc, or myc-Ago1. (F) Assay for silencing of 4xTetO-ade6+ via tethered wild-type or mutant TetRoff-Stc1 (red colonies indicate ade6+ silencing, white colonies ade6+ expression) and ChIP analysis of H3K9me2 levels on 4xTetO-ade6+. See also Figure S5. All error bars indicate SD.
Figure 7
Figure 7
Model for the Function of Stc1 (A) Dcr1-generated siRNAs associate with Ago1 and guide RITS to homologous nascent transcripts. Once RITS has engaged these transcripts it recruits Stc1 via the LIM domain, which mediates the association of Clr4 methyltransferase activity/CLRC. In this way, Stc1 connects the chromatin modification machinery with the siRNA targeting signal, facilitating RNAi-directed H3K9 methylation and heterochromatin formation. (B) Tethering Stc1 to DNA via a DNA-binding domain fusion bypasses the requirement for the siRNA-dependent targeting of RITS to nascent transcripts that normally mediates localization of Stc1 to chromatin. Thus, in this system Stc1 can recruit Clr4 methyltransferase activity to target chromatin independent of active RNAi and of its association with Ago1/RITS.
Figure S1
Figure S1
Deletion of Stc1 Results in High Rates of Minichromosome Loss and Sensitivity to TBZ, Related to Figure 1 (A) Minichromosome loss assay. The 530kb minichromosome Ch16 carries the ade6-216 allele that complements the ade6-210 allele, resulting in white, ade6+ expressing colonies. Wild-type or mutant cells containing the Ch16 minichromosome were grown in media lacking adenine (to select for retention of the plasmid) and then plated on media containing limiting adenine. A minichromosome loss event in the first division following plating results in a colony that is sectored half red/half white. The rate of minichromsome loss per division is therefore indicated by the percentage of half-sectored colonies. (B) TBZ sensitivity assay. Wild-type or mutant cells were plated on non-selective media (N/S), or media containing the microtubule-destablising drug thiabendazole.
Figure S2
Figure S2
Stc1 Is Not Required for Maintenance of Silencing at Telomeres, Related to Figure 2 Assay for silencing at a telomeric his3+ marker gene (tel1:his3+) in wild-type or mutant backgrounds. Plates are non-selective (N/S) or lacking histidine (-HIS); growth on -HIS indicates loss of silencing.
Figure S3
Figure S3
Related to Figure 3 (A) Overview of analysis of proteins associated with affinity purified Stc1-FLAG by mass spectrometry. Four independent FLAG affinity purifications were performed on cells expressing either Stc1-FLAG or untagged Stc1 (WT), and co-precipitating proteins were identified by LC-MS/MS. Complete lists of identified proteins are in Tables S3 and S4. Of 367 proteins identified in Stc1-FLAG immunoprecipitates, 237 were discarded because they were also found in WT. Of the 130 proteins identified specifically in Stc1-FLAG immuno-precipitates, 103 were discarded on the basis that they were identified in less than two of the four replicates (single hit), and a further 16 were discarded because they were ribosomal proteins, which are common contaminants. This left eleven proteins which formed the final shortlist of specific and reproducible Stc1-associated proteins presented in Figure 3. (B–E) Stc1-FLAG IP followed by western analysis demonstrating that Stc1 associates with CLRC components and Ago1, but not with RDRC components. (F) Chp1-FLAG IP followed by western analysis, demonstrating that association of Rdp1 with Chp1 depends on Stc1 and Dcr1. (G) IP of Rik1-FLAG or Dos2-FLAG in wild-type or stc1Δ backgrounds, followed by western analysis of associated GFP-Dos1, demonstrating that interactions between CLRC components are unaffected by deletion of Stc1. (H) In vitro binding assay showing specific interaction of 35S-labeled Ago1 with recombinant GST-Stc1. GST-Scm3 and 35S-Cid12 are negative controls.
Figure S4
Figure S4
Related to Figure 4 (A) Stc1 associates with the silent mating-type locus and with telomeres. ChIP analysis of Stc1-FLAG association with the silent mating-type locus (mat) or the telomere-associated tlh+genes, relative to act1+, in wild-type or mutant backgrounds. (B and C) Stc1 specifically associates with centromere transcripts. (B) RNA-immunoprecipitation (RNA-IP) analysis of cen transcripts associated with FLAG-tagged Stc1, Clr4, Rik1 or Dos2 under native conditions. (C) Western analysis of FLAG immunoprecipitates from a single strain expressing both FLAG-tagged Rik1 and Stc1, showing that similar amounts of the two proteins are immunoprecipitated (Rik1 1.1x Stc1). Differences in amounts of RNA found in the immunoprecipitates are therefore not due to differences in amounts of protein pulled down.
Figure S5
Figure S5
Stc1 Contains a LIM Domain Required for Its Function, Related to Figure 6 (A) Representative multiple sequence alignment of the N-terminal conserved region of Stc1 homologous proteins. Mutated residues mentioned in the text (C83A, C93A, K100A and R116A) are highlighted. The phyletic groups of Stc1 homologous proteins are indicated by colored bars at each side of the alignment: yellow (fungi) and green (algae). The alignment coloring scheme provides an indication of average BLOSUM62 scores (correlated with amino acid conservation) for each alignment column: red (greater than 3), violet (between 3 and 1) and light yellow (between 1 and 0.3). Sequences were obtained from UniProt, GenBank and DOE-JGI (Joint Genome Institute) databases, but were supplemented by manually assembled ESTs and FGENESH+ predicted gene models (Softberry). Sequences are named according to their species abbreviation. Database of origin, accession numbers (“mod” prefix identifies UniProt sequences corrected by gene prediction software FGENESH+) and full species names are: In fungi: O94276_SCHPO Stc1, Schizosaccharomyces pombe; B6K2E2_SCHJY, SchizoSaccharomyces japonicus; modQ0UKA2_PHANO, Phaeosphaeria nodorum; jgi_Coche, Cochliobolus heterostrophus; B2WPU1_PYRTR, Pyrenophora tritici-repentis; B6QC22_PENMQ, Penicillium marneffei; Q1DX71_COCIM, Coccidioides immitis; modA6RAF6_AJECN, Ajellomyces capsulata; modC1GI81_PARBR, Paracoccidioides brasiliensis; B8NGM5_ASPFN, Aspergillus flavus; Q0CYE9_ASPTN, Aspergillus terreus; modA2QC11_ASPNC, Aspergillus niger; modA1C6Z3_ASPCL, Aspergillus clavatus; A1DHM0_NEOFI, Neosartorya fischeri; jgi_Mycgr, Mycosphaerella graminicola; jgi_Mycfi, Mycosphaerella fijiensis; est1_Rhior EE004662, Rhizopus oryzae; A7EYF8_SCLS1, Sclerotinia sclerotiorum; B6GWR5_PENCW, Penicillium chrysogenum; modA4RHU1_MAGGR, Magnaporthe grisea; modB2B0Z8_PODAN, Podospora anserina; Q2GNQ5_CHAGB, Chaetomium globosum; Q96U02_NEUCR, Neurospora crassa;UPI_GIBZE UPI000023D198, Gibberella zeae. In algae: jgi_Ostlu, Ostreococcus lucimarinus; Q00T90_OSTTA, Ostreococcus tauri; jgi_OstRC, Ostreococcus RCC809; jgi_MicCC, Micromonas CCMP1545; C1E4D8_9CHLO, Micromonas sp. RCC299; jgi2_Emihu, Emiliania huxleyi; jgi_Auran, Aureococcus anophagefferens; modB7GAR1_PHATR, Phaeodactylum tricornutum; SargassoSeaMeta AACY022272749, Sargasso Sea Metagenome; jgi1_Emihu, Emiliania huxleyi. (B) The N terminus of Stc1 bears statistically significant similarity to LIM domains. Numbers correspond to global profile-to-sequence (in black) and profile-to-profile (in blue) comparison E-values obtained from HMMer and HHpred, respectively (Eddy, 1996; Söding et al., 2005). Arrows indicate the profile search direction. (C) Domain architectures of two members of the Stc1 family. (D) Stc1K100A and Stc1R116A LIM domain mutant proteins are stable. FLAG-tagged wild-type and mutant Stc1 proteins were affinity purified from cell lysates and analyzed by western using anti-FLAG antibody. (E) Stc1 LIM domain mutants exhibit high rates of lagging chromosomes consistent with defects in centromere silencing. (F) Assay for silencing of 3xgbs-ade6+, mediated by tethered Clr4 (GBD-Clr4-Δcd). The GBD-Clr4-Δcd and 3xgbs-ade6+ constructs were combined in either wild-type or mutant backgrounds to assess establishment of silencing upon recruitment of GBD-Clr4. Establishment of silencing at 3xgbs-ade6+ results in red colonies on limiting adenine; if silencing is not established colonies remain white. (G) ChIP analysis of H3K9me2 levels on 3xgbs-ade6+. Eddy, S.R. (1996). Hidden Markov models. Curr. Opin. Struct. Biol. 6, 361–365. Söding, J., Biegert, A., and Lupas, A.N. (2005). The HHpred interactive server for protein homology detection and structure prediction. Nucleic Acids Res. 33 (Web Server issue), W244–W248.

Similar articles

Cited by

References

    1. Allshire R.C., Nimmo E.R., Ekwall K., Javerzat J.P., Cranston G. Mutations derepressing silent centromeric domains in fission yeast disrupt chromosome segregation. Genes Dev. 1995;9:218–233. - PubMed
    1. Altschul S.F., Madden T.L., Schäffer A.A., Zhang J., Zhang Z., Miller W., Lipman D.J. Gapped BLAST and PSI-BLAST: a new generation of protein database search programs. Nucleic Acids Res. 1997;25:3389–3402. - PMC - PubMed
    1. Bähler J., Wu J.Q., Longtine M.S., Shah N.G., McKenzie A., 3rd, Steever A.B., Wach A., Philippsen P., Pringle J.R. Heterologous modules for efficient and versatile PCR-based gene targeting in Schizosaccharomyces pombe. Yeast. 1998;14:943–951. - PubMed
    1. Bannister A.J., Zegerman P., Partridge J.F., Miska E.A., Thomas J.O., Allshire R.C., Kouzarides T. Selective recognition of methylated lysine 9 on histone H3 by the HP1 chromo domain. Nature. 2001;410:120–124. - PubMed
    1. Bayne E.H., Portoso M., Kagansky A., Kos-Braun I.C., Urano T., Ekwall K., Alves F., Rappsilber J., Allshire R.C. Splicing factors facilitate RNAi-directed silencing in fission yeast. Science. 2008;322:602–606. - PMC - PubMed

Publication types

MeSH terms