An atlas of combinatorial transcriptional regulation in mouse and man
- PMID: 20211142
- PMCID: PMC2836267
- DOI: 10.1016/j.cell.2010.01.044
An atlas of combinatorial transcriptional regulation in mouse and man
Erratum in
- Cell. 2010 Apr 16;141(2):369. Kamburov, Atanas [added]; Kaur, Mandeep [added]; MacPherson, Cameron Ross [added]; Radovanovic, Aleksandar [added]; Schwartz, Ariel [added]
Abstract
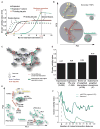
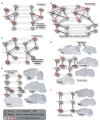
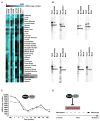
Combinatorial interactions among transcription factors are critical to directing tissue-specific gene expression. To build a global atlas of these combinations, we have screened for physical interactions among the majority of human and mouse DNA-binding transcription factors (TFs). The complete networks contain 762 human and 877 mouse interactions. Analysis of the networks reveals that highly connected TFs are broadly expressed across tissues, and that roughly half of the measured interactions are conserved between mouse and human. The data highlight the importance of TF combinations for determining cell fate, and they lead to the identification of a SMAD3/FLI1 complex expressed during development of immunity. The availability of large TF combinatorial networks in both human and mouse will provide many opportunities to study gene regulation, tissue differentiation, and mammalian evolution.
(c) 2010 Elsevier Inc. All rights reserved.
Conflict of interest statement
Figures


Comment in
-
Transcription fact or interact ion maps.Nat Methods. 2010 May;7(5):344-5. doi: 10.1038/nmeth0510-344b. Nat Methods. 2010. PMID: 20440881 No abstract available.
Similar articles
-
Computational identification of tissue-specific transcription factor cooperation in ten cattle tissues.PLoS One. 2019 May 16;14(5):e0216475. doi: 10.1371/journal.pone.0216475. eCollection 2019. PLoS One. 2019. PMID: 31095599 Free PMC article.
-
Tissue-specific atlas of trans-models for gene regulation elucidates complex regulation patterns.BMC Genomics. 2024 Apr 17;25(1):377. doi: 10.1186/s12864-024-10317-y. BMC Genomics. 2024. PMID: 38632500 Free PMC article.
-
Transcriptional regulatory networks underlying gene expression changes in Huntington's disease.Mol Syst Biol. 2018 Mar 26;14(3):e7435. doi: 10.15252/msb.20167435. Mol Syst Biol. 2018. PMID: 29581148 Free PMC article.
-
Transcription factor interactions in genomic nuclear receptor function.Epigenomics. 2011 Aug;3(4):471-85. doi: 10.2217/epi.11.66. Epigenomics. 2011. PMID: 22126206 Review.
-
Coordinated networks of microRNAs and transcription factors with evolutionary perspectives.Adv Exp Med Biol. 2013;774:169-87. doi: 10.1007/978-94-007-5590-1_10. Adv Exp Med Biol. 2013. PMID: 23377974 Review.
Cited by
-
Co-regulation of translation in protein complexes.Biol Direct. 2015 Apr 25;10:18. doi: 10.1186/s13062-015-0048-7. Biol Direct. 2015. PMID: 25909184 Free PMC article.
-
Simultaneous generation of many RNA-seq libraries in a single reaction.Nat Methods. 2015 Apr;12(4):323-5. doi: 10.1038/nmeth.3313. Epub 2015 Mar 2. Nat Methods. 2015. PMID: 25730492 Free PMC article.
-
Cell-type specificity of ChIP-predicted transcription factor binding sites.BMC Genomics. 2012 Aug 3;13:372. doi: 10.1186/1471-2164-13-372. BMC Genomics. 2012. PMID: 22863112 Free PMC article.
-
A FOXM1 Dependent Mesenchymal-Epithelial Transition in Retinal Pigment Epithelium Cells.PLoS One. 2015 Jun 29;10(6):e0130379. doi: 10.1371/journal.pone.0130379. eCollection 2015. PLoS One. 2015. PMID: 26121260 Free PMC article.
-
Extracting a low-dimensional description of multiple gene expression datasets reveals a potential driver for tumor-associated stroma in ovarian cancer.Genome Med. 2016 Jun 10;8(1):66. doi: 10.1186/s13073-016-0319-7. Genome Med. 2016. PMID: 27287041 Free PMC article.
References
-
- Ameyar M, Wisniewska M, Weitzman JB. A role for AP-1 in apoptosis: the case for and against. Biochimie. 2003;85:747–752. - PubMed
-
- Davidson EH, Rast JP, Oliveri P, Ransick A, Calestani C, Yuh CH, Minokawa T, Amore G, Hinman V, Arenas-Mena C, et al. A genomic regulatory network for development. Science. 2002;295:1669–1678. - PubMed
Publication types
MeSH terms
Substances
Grants and funding
LinkOut - more resources
Full Text Sources
Other Literature Sources
Molecular Biology Databases
Miscellaneous

