. 2010 Jul 1;51(3):943-51.
doi: 10.1016/j.neuroimage.2010.03.004. Epub 2010 Mar 6.

Age-related changes in grey and white matter structure throughout adulthood

Affiliations

Age-related changes in grey and white matter structure throughout adulthood

Antonio Giorgio et al. Neuroimage. .

Abstract

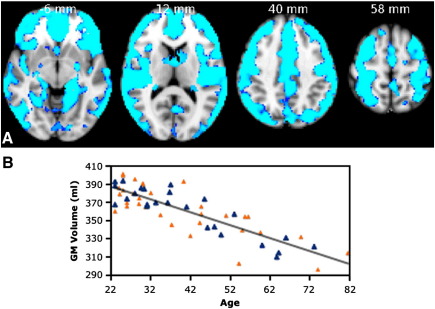
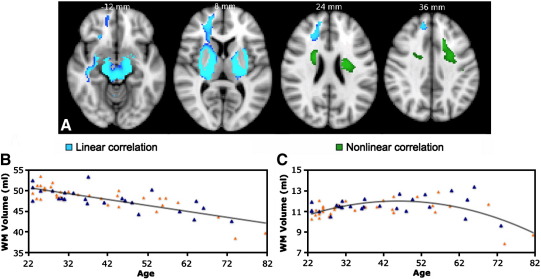
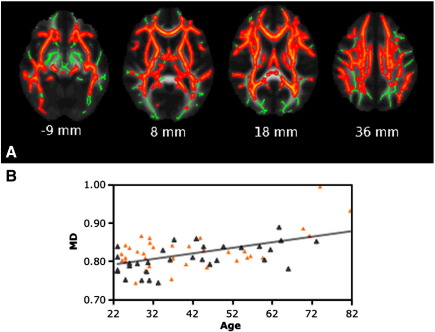
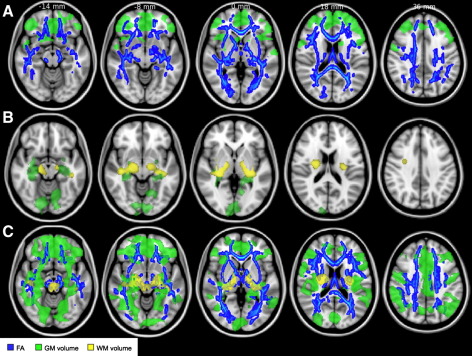
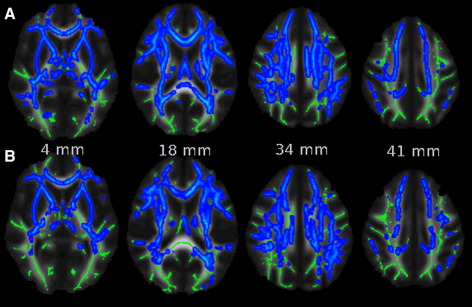
Normal ageing is associated with gradual brain atrophy. Determining spatial and temporal patterns of change can help shed light on underlying mechanisms. Neuroimaging provides various measures of brain structure that can be used to assess such age-related change but studies to date have typically considered single imaging measures. Although there is consensus on the notion that brain structure deteriorates with age, evidence on the precise time course and spatial distribution of changes is mixed. We assessed grey matter (GM) and white matter (WM) structure in a group of 66 adults aged between 23 and 81. Multimodal imaging measures included voxel-based morphometry (VBM)-style analysis of GM and WM volume and diffusion tensor imaging (DTI) metrics of WM microstructure. We found widespread reductions in GM volume from middle age onwards but earlier reductions in GM were detected in frontal cortex. Widespread age-related deterioration in WM microstructure was detected from young adulthood onwards. WM decline was detected earlier and more sensitively using DTI-based measures of microstructure than using markers of WM volume derived from conventional T1-weighted imaging.


Figures

Fig. 1
Fig. 1
VBM-style analysis of GM changes with age. (A) Coloured voxels show regions demonstrating significant negative correlations between GM volume and age (p < 0.05, fully corrected for multiple comparisons across space). Clusters are overlaid on the MNI152 template brain. Images are shown in radiological convention. (B) Plot to illustrate relationship between age and mean GM volume across all significant voxels. The orange triangles represent female subjects.
Fig. 2
Fig. 2
VBM-style analysis of WM changes with age. (A) Coloured voxels show regions where WM volume shows a significant linear (blue) or non-linear (green) relationship with age (p < 0.05, fully corrected for multiple comparisons across space). Clusters are overlaid on the MNI152 template brain. Images are shown in radiological convention. (B, C) Plots to illustrate relationship between age and mean WM volume across all voxels showing a significant linear (B) or nonlinear (C) relationship with age. The orange triangles represent female subjects.
Fig. 3
Fig. 3
TBSS analysis of changes in FA with age. (A) Blue voxels show WM regions where FA shows a significant negative linear relationship with age (p < 0.05, fully corrected for multiple comparisons across space). Voxels are overlaid on the WM skeleton (in green) and the group mean FA image (greyscale). Images are shown in radiological convention. (B, C, D) Plots to illustrate the relationship between age and mean FA (B), perpendicular diffusivity (C) and parallel diffusivity (D) across all voxels showing a significant linear relationship between age and FA. The orange triangles represent female subjects.
Fig. 4
Fig. 4
TBSS analysis of changes in MD with age. (A) Red voxels show WM regions where MD shows a significant positive linear relationship with age (p < 0.05, fully corrected for multiple comparisons across space). Voxels are overlaid on the WM skeleton (in green) and the group mean FA image (greyscale). Images are shown in radiological convention. (B) Plot to illustrate the relationship between age and mean MD across all voxels showing a significant linear relationship between age and MD. The orange triangles represent female subjects.
Fig. 5
Fig. 5
Subgroup analysis of GM volume and WM volume and FA. (A) Comparisons between the YA and MA subgroups revealed reductions in frontal GM volume (green) and in FA throughout the WM skeleton (blue). (B) Comparisons between the MA and OA subgroups revealed later reductions in posterior GM volume (green) and in WM volume at the level of internal capsule and corona radiata (yellow). (C) Comparisons between the YA and OA subgroups revealed widespread reductions in GM volume (green) and FA (blue) and more localised reductions in WM volume (yellow). All analyses were thresholded at p < 0.05, fully corrected for multiple comparisons across space. See text for abbreviations. Images are shown in radiological convention.
Fig. 6
Fig. 6
Subgroup analysis of WM MD. (A) Comparisons between the YA and OA subgroups revealed MD increase in OA (blue) in most of the WM regions. (B) Comparisons between the MA and OA subgroups revealed MD increase in OA (blue) in most of the WM regions. All analyses were thresholded at p < 0.05, fully corrected for multiple comparisons across space. See text for abbreviations. Images are shown in radiological convention.

References

    1. Abe O., Aoki S., Hayashi N., Yamada H., Kunimatsu A., Mori H., Yoshikawa T., Okubo T., Ohtomo K. Normal aging in the central nervous system: quantitative MR diffusion-tensor analysis. Neurobiol. Aging. 2002;23:433–441. - PubMed
    1. Anderson V.C., Litvack Z.N., Kaye J.A. Magnetic resonance approaches to brain aging and Alzheimer disease-associated neuropathology. Top. Magn. Reson. Imaging. 2005;16:439–452. - PubMed
    1. Andersson, J.L.R., Jenkinson, M., Smith, S., 2007. Non-linear optimisation. FMRIB technical report TR07JA1 from www.fmrib.ox.ac.uk/analysis/techrep.
    1. Andersson, J.L.R., Jenkinson, M., Smith, S., 2007. Non-linear registration, aka Spatial normalisation. FMRIB technical report TR07JA2 from www.fmrib.ox.ac.uk/analysis/techrep.
    1. Ardekani S., Kumar A., Bartzokis G., Sinha U. Exploratory voxel-based analysis of diffusion indices and hemispheric asymmetry in normal aging. Magn. Reson. Imaging. 2007;25:154–167. - PubMed

Publication types