

Tensor-based morphometry with stationary velocity field diffeomorphic registration: application to ADNI
- PMID: 20211269
- PMCID: PMC3068621
- DOI: 10.1016/j.neuroimage.2010.02.061
Tensor-based morphometry with stationary velocity field diffeomorphic registration: application to ADNI
Abstract
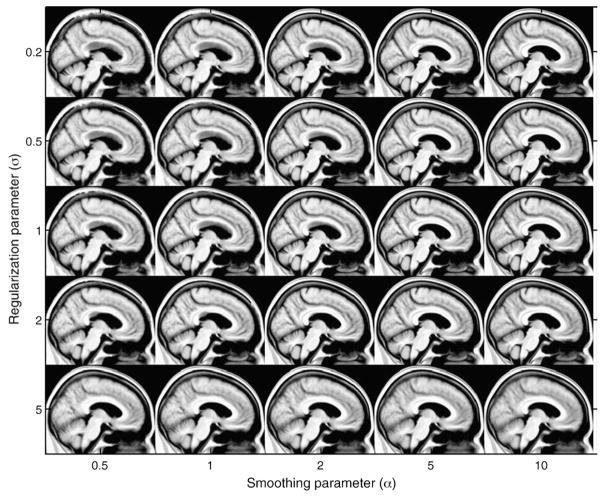
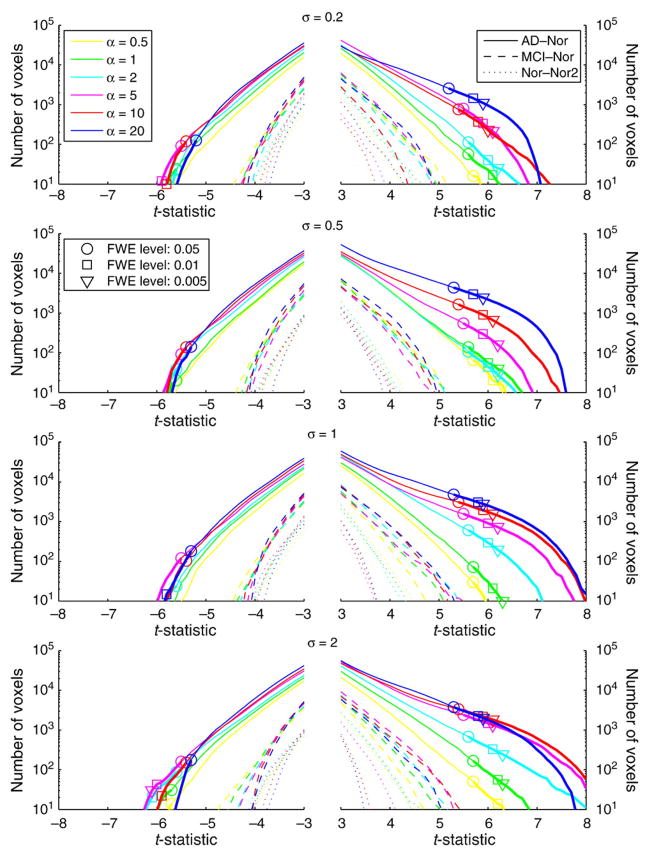
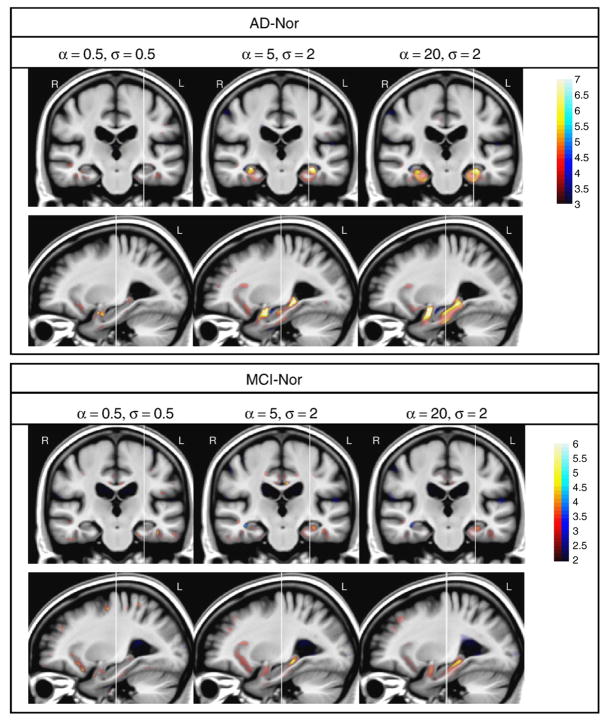
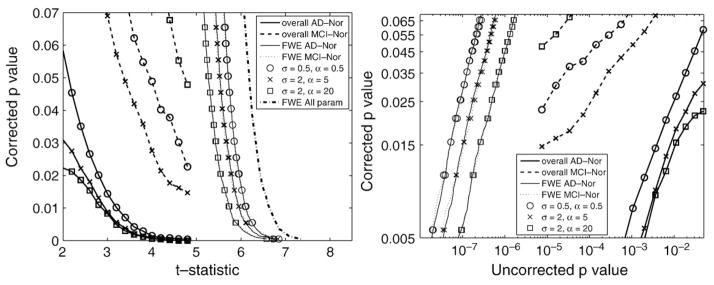
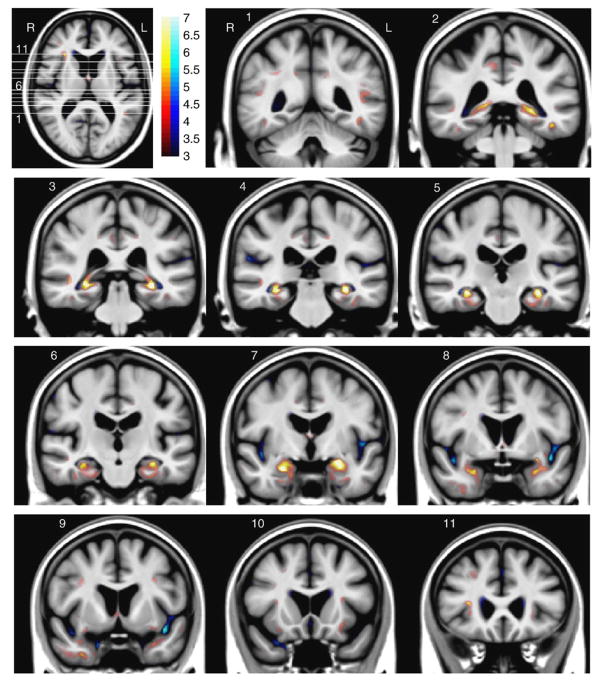
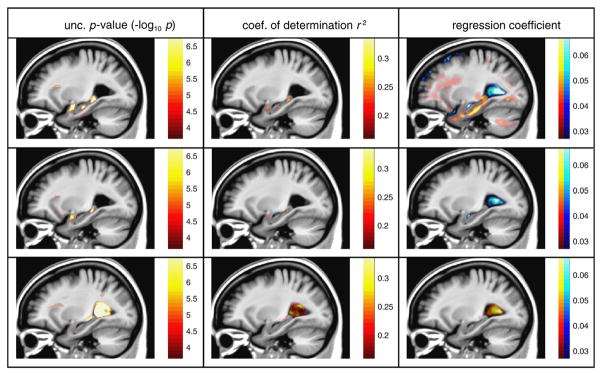
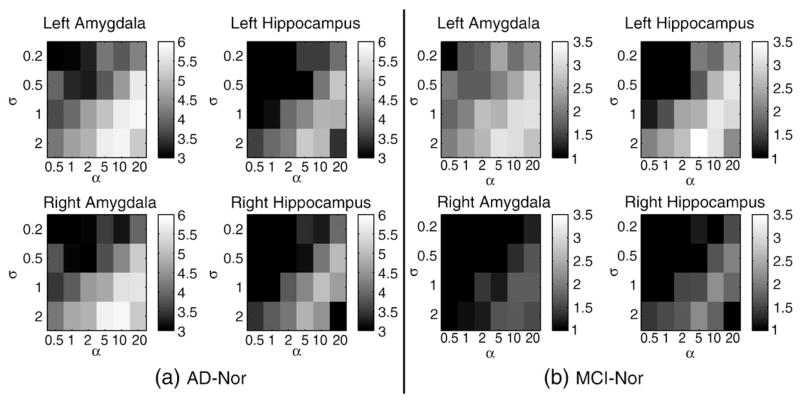
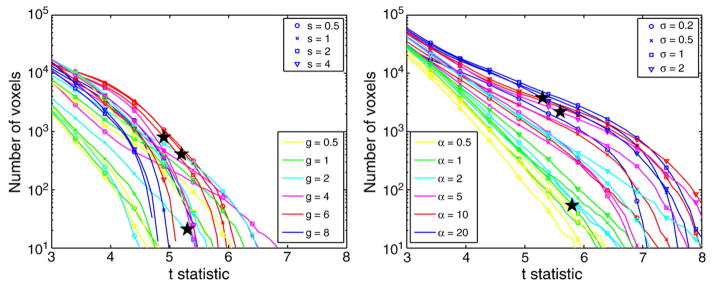
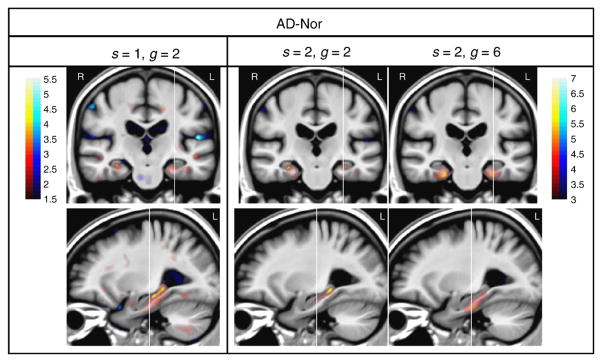
Tensor-based morphometry (TBM) is an analysis technique where anatomical information is characterized by means of the spatial transformations mapping a customized template with the observed images. Therefore, accurate inter-subject non-rigid registration is an essential prerequisite for both template estimation and image warping. Subsequent statistical analysis on the spatial transformations is performed to highlight voxel-wise differences. Most of previous TBM studies did not explore the influence of the registration parameters, such as the parameters defining the deformation and the regularization models. In this work performance evaluation of TBM using stationary velocity field (SVF) diffeomorphic registration was performed in a subset of subjects from Alzheimer's Disease Neuroimaging Initiative (ADNI) study. A wide range of values of the registration parameters that define the transformation smoothness and the balance between image matching and regularization were explored in the evaluation. The proposed methodology provided brain atrophy maps with very detailed anatomical resolution and with a high significance level compared with results recently published on the same data set using a non-linear elastic registration method.
Copyright (c) 2010 Elsevier Inc. All rights reserved.
Figures
Similar articles
-
Tensor-based morphometry with mappings parameterized by stationary velocity fields in Alzheimer's disease neuroimaging initiative.Med Image Comput Comput Assist Interv. 2009;12(Pt 2):240-7. doi: 10.1007/978-3-642-04271-3_30. Med Image Comput Comput Assist Interv. 2009. PMID: 20426118
-
Comparing registration methods for mapping brain change using tensor-based morphometry.Med Image Anal. 2009 Oct;13(5):679-700. doi: 10.1016/j.media.2009.06.002. Epub 2009 Jun 24. Med Image Anal. 2009. PMID: 19631572 Free PMC article.
-
Simultaneous consideration of spatial deformation and tensor orientation in diffusion tensor image registration using local fast marching patterns.Inf Process Med Imaging. 2009;21:63-75. doi: 10.1007/978-3-642-02498-6_6. Inf Process Med Imaging. 2009. PMID: 19694253
-
Software for image registration: algorithms, accuracy, efficacy.Semin Nucl Med. 2003 Jul;33(3):180-92. doi: 10.1053/snuc.2003.127309. Semin Nucl Med. 2003. PMID: 12931320 Review.
-
Challenges of High-resolution Diffusion Imaging of the Human Medial Temporal Lobe in Alzheimer Disease.Top Magn Reson Imaging. 2010 Dec;21(6):355-65. doi: 10.1097/RMR.0b013e31823f6413. Top Magn Reson Imaging. 2010. PMID: 22158129 Free PMC article. Review.
Cited by
-
The Development of a Practical Artificial Intelligence Tool for Diagnosing and Evaluating Autism Spectrum Disorder: Multicenter Study.JMIR Med Inform. 2020 May 8;8(5):e15767. doi: 10.2196/15767. JMIR Med Inform. 2020. PMID: 32041690 Free PMC article.
-
Altered reward circuitry in the norepinephrine transporter knockout mouse.PLoS One. 2013;8(3):e57597. doi: 10.1371/journal.pone.0057597. Epub 2013 Mar 4. PLoS One. 2013. PMID: 23469209 Free PMC article.
-
Advancing the Frontier: Neuroimaging Techniques in the Early Detection and Management of Neurodegenerative Diseases.Cureus. 2024 May 29;16(5):e61335. doi: 10.7759/cureus.61335. eCollection 2024 May. Cureus. 2024. PMID: 38947709 Free PMC article. Review.
-
A Bayesian model of shape and appearance for subcortical brain segmentation.Neuroimage. 2011 Jun 1;56(3):907-22. doi: 10.1016/j.neuroimage.2011.02.046. Epub 2011 Feb 23. Neuroimage. 2011. PMID: 21352927 Free PMC article.
-
Statistical analysis of relative pose information of subcortical nuclei: application on ADNI data.Neuroimage. 2011 Apr 1;55(3):999-1008. doi: 10.1016/j.neuroimage.2010.12.078. Epub 2011 Jan 7. Neuroimage. 2011. PMID: 21216295 Free PMC article.
References
-
- Allassonniere S, Amit Y, Trouve A. Towards a coherent statistical framework for dense deformable template estimation. J R Stat Soc B Stat Methodol. 2007;69:3–29.
-
- Apostolova LG, Thompson PM. Mapping progressive brain structural changes in early Alzheimer’s disease and mild cognitive impairment. Neuropsychologia. 2008. pp. 1597–1612. ( http://www.dx.doi.org/10.1016/j.neuropsychologia.2007.10.026) - DOI - PMC - PubMed
-
- Arsigny V. PhD Thesis, École polytechnique. 2006. Processing data in Lie groups: An algebraic approach. application to non-linear registration and diffusion tensor MRI.
-
- Arsigny V, Commowick O, Pennec X, Ayache N. A log-Euclidean framework for statistics on diffeomorphisms. In: Larsen R, MN, Sporring J, editors. LNCS; Proc. MICCAI’06; Springer-Verlag; 2006. pp. 924–931. - PubMed
-
- Ashburner J. A fast diffeomorphic image registration algorithm. NeuroImage. 2007;38(1):95–113. (10/15) - PubMed
Publication types
MeSH terms
Grants and funding
LinkOut - more resources
Full Text Sources
Medical
