

Attenuation of colistin bactericidal activity by high inoculum of Pseudomonas aeruginosa characterized by a new mechanism-based population pharmacodynamic model
- PMID: 20211900
- PMCID: PMC2863601
- DOI: 10.1128/AAC.00881-09
Attenuation of colistin bactericidal activity by high inoculum of Pseudomonas aeruginosa characterized by a new mechanism-based population pharmacodynamic model
Abstract
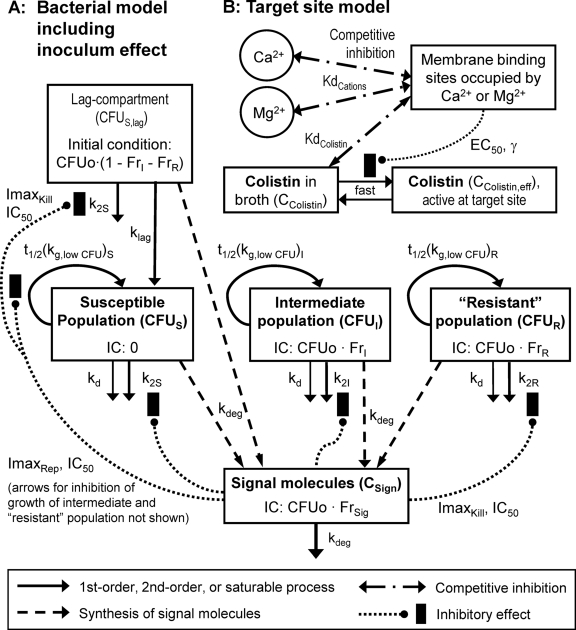
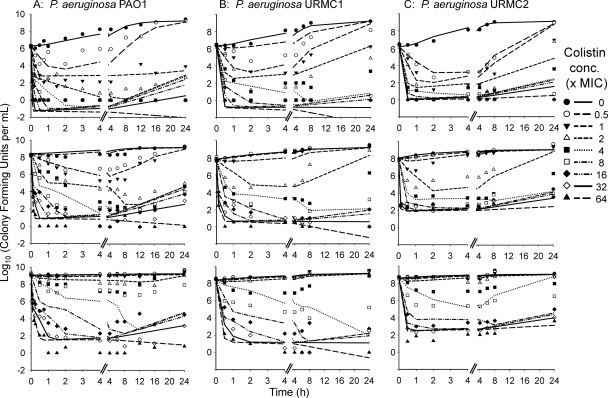
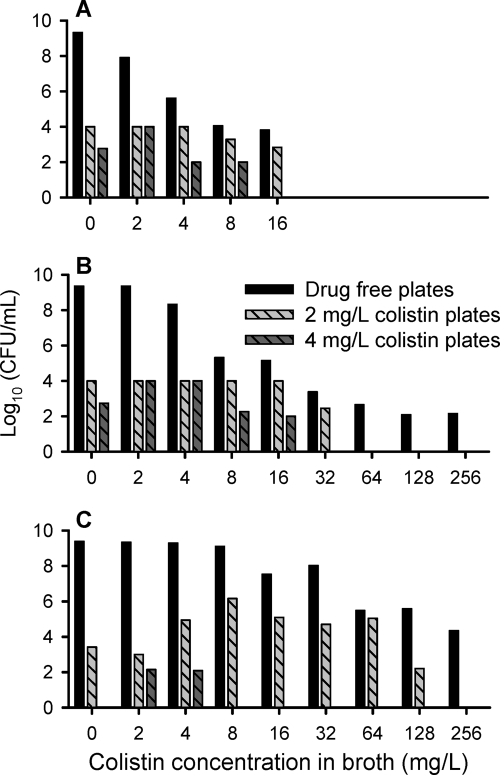
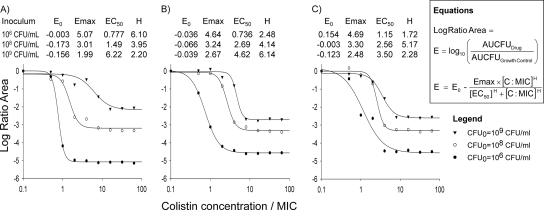
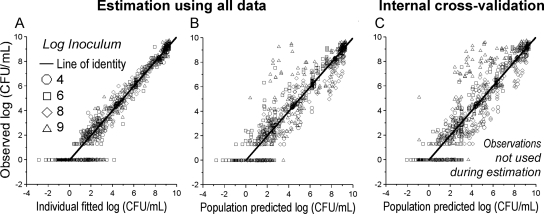
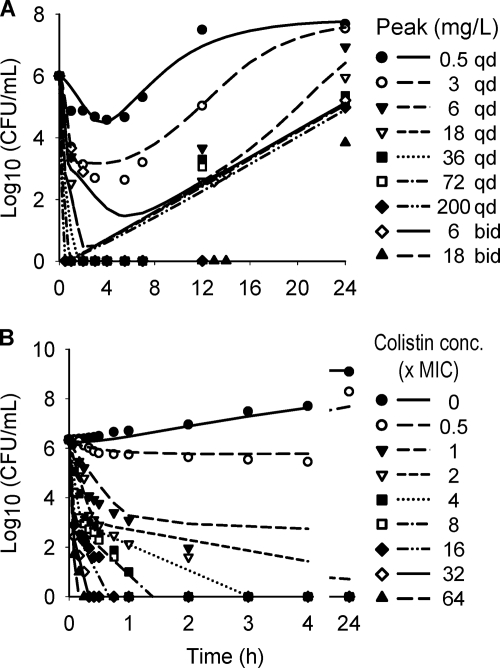
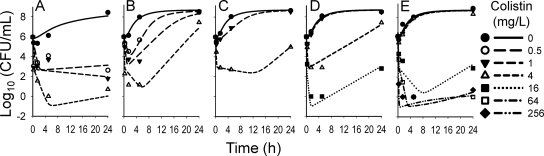
Colistin is increasingly being utilized against Gram-negative pathogens, including Pseudomonas aeruginosa, resistant to all other antibiotics. Since limited data exist regarding killing by colistin at different initial inocula (CFUo), we evaluated killing of Pseudomonas aeruginosa by colistin at several CFUo and developed a mechanism-based mathematical model accommodating a range of CFUo. In vitro time-kill experiments were performed using >or=8 concentrations up to 64 x the MIC of colistin against P. aeruginosa PAO1 and two clinical P. aeruginosa isolates at CFUo of 10(6), 10(8), and 10(9) CFU/ml. Serial samples up to 24 h were simultaneously modeled in the NONMEM VI (results shown) and S-ADAPT software programs. The mathematical model was prospectively "validated" by additional time-kill studies assessing the effect of Ca(2+) and Mg(2+) on killing of PAO1 by colistin. Against PAO1, killing of the susceptible population was 23-fold slower at the 10(9) CFUo and 6-fold slower at the 10(8) CFUo than at the 10(6) CFUo. The model comprised three populations with different second-order killing rate constants (5.72, 0.369, and 0.00210 liters/h/mg). Bacteria were assumed to release signal molecules stimulating a phenotypic change that inhibits killing. The proposed mechanism-based model had a good predictive performance, could describe killing by colistin for all three studied strains and for two literature studies, and performed well in a prospective validation with various concentrations of Ca(2+) and Mg(2+). The extent and rate of killing of P. aeruginosa by colistin were markedly decreased at high CFUo compared to those at low CFUo. This was well described by a mechanism-based mathematical model, which should be further validated using dynamic in vitro models.
Figures
Similar articles
-
Development and qualification of a pharmacodynamic model for the pronounced inoculum effect of ceftazidime against Pseudomonas aeruginosa.Antimicrob Agents Chemother. 2009 Jan;53(1):46-56. doi: 10.1128/AAC.00489-08. Epub 2008 Oct 13. Antimicrob Agents Chemother. 2009. PMID: 18852268 Free PMC article.
-
A pharmacokinetic/pharmacodynamic model developed for the effect of colistin on Pseudomonas aeruginosa in vitro with evaluation of population pharmacokinetic variability on simulated bacterial killing.J Antimicrob Chemother. 2014 May;69(5):1350-61. doi: 10.1093/jac/dkt520. Epub 2014 Jan 27. J Antimicrob Chemother. 2014. PMID: 24474432
-
Dynamic interaction of colistin and meropenem on a WT and a resistant strain of Pseudomonas aeruginosa as quantified in a PK/PD model.J Antimicrob Chemother. 2016 May;71(5):1279-90. doi: 10.1093/jac/dkv488. Epub 2016 Feb 4. J Antimicrob Chemother. 2016. PMID: 26850719
-
Colistin and doripenem combinations against Pseudomonas aeruginosa: profiling the time course of synergistic killing and prevention of resistance.J Antimicrob Chemother. 2015 May;70(5):1434-42. doi: 10.1093/jac/dku567. Epub 2015 Feb 23. J Antimicrob Chemother. 2015. PMID: 25712313 Free PMC article.
-
Evaluation of colistin as an agent against multi-resistant Gram-negative bacteria.Int J Antimicrob Agents. 2005 Jan;25(1):11-25. doi: 10.1016/j.ijantimicag.2004.10.001. Int J Antimicrob Agents. 2005. PMID: 15620821 Review.
Cited by
-
Mechanism-Based Pharmacokinetic/Pharmacodynamic Modeling of Aerosolized Colistin in a Mouse Lung Infection Model.Antimicrob Agents Chemother. 2018 Feb 23;62(3):e01965-17. doi: 10.1128/AAC.01965-17. Print 2018 Mar. Antimicrob Agents Chemother. 2018. PMID: 29263069 Free PMC article.
-
Once Versus Thrice Daily Colistin in Critically Ill Ptients with Multi-Drug Resistant Infections.Iran J Pharm Res. 2017 Summer;16(3):1247-1253. Iran J Pharm Res. 2017. PMID: 29201114 Free PMC article.
-
Resurgence of colistin: a review of resistance, toxicity, pharmacodynamics, and dosing.Pharmacotherapy. 2010 Dec;30(12):1279-91. doi: 10.1592/phco.30.12.1279. Pharmacotherapy. 2010. PMID: 21114395 Free PMC article. Review.
-
Dosing of colistin-back to basic PK/PD.Curr Opin Pharmacol. 2011 Oct;11(5):464-9. doi: 10.1016/j.coph.2011.07.004. Epub 2011 Aug 9. Curr Opin Pharmacol. 2011. PMID: 21835694 Free PMC article. Review.
-
Novel approach to optimize synergistic carbapenem-aminoglycoside combinations against carbapenem-resistant Acinetobacter baumannii.Antimicrob Agents Chemother. 2015 Apr;59(4):2286-98. doi: 10.1128/AAC.04379-14. Epub 2015 Feb 2. Antimicrob Agents Chemother. 2015. PMID: 25645842 Free PMC article.
References
-
- Ambrose, P. G., S. M. Bhavnani, C. M. Rubino, A. Louie, T. Gumbo, A. Forrest, and G. L. Drusano. 2007. Pharmacokinetics-pharmacodynamics of antimicrobial therapy: it's not just for mice anymore. Clin. Infect. Dis. 44:79-86. - PubMed
-
- Andes, D., and W. A. Craig. 2002. Animal model pharmacokinetics and pharmacodynamics: a critical review. Int. J. Antimicrob. Agents 19:261-268. - PubMed
-
- Aoki, N., K. Tateda, Y. Kikuchi, S. Kimura, C. Miyazaki, Y. Ishii, Y. Tanabe, F. Gejyo, and K. Yamaguchi. 2009. Efficacy of colistin combination therapy in a mouse model of pneumonia caused by multidrug-resistant Pseudomonas aeruginosa. J. Antimicrob. Chemother. 63:534-542. - PubMed
-
- Bauer, R. J. 2008. S-ADAPT/MCPEM user's guide (version 1.56). Software for pharmacokinetic, pharmacodynamic and population data analysis. Biomedical Simulations Resource, Berkeley, CA.
Publication types
MeSH terms
Substances
Grants and funding
LinkOut - more resources
Full Text Sources
Medical
Miscellaneous
